ABSTRACT
Deforestation in Brazilian Amazonia causes
severe impacts on biodiversity, global warming and water cycling. These impacts have local, regional and global
consequences, the avoidance of which provides ample justification for major
international investments with the objective of slowing deforestation. The approaches taken to slowing
deforestation, the amount of money allocated to the purpose, and the institutional
mechanisms created to administer the money and regulate its use will determine
the effectiveness of environmental services as a means of maintaining both the
forest and the people in rural Amazonia.
A long series of impediments stands in the way of achieving these
objectives. One is the need for better
evaluations of the magnitude of deforestation impacts, the willingness to pay
for avoiding these impacts, and the effectiveness of different actions that might
be taken to slow forest loss. The financial
and intellectual resources of the international community can play important
roles in these and other tasks needed to shift the paradigm of Amazonian
development from one based on removal and export of natural resources to one
based on environmental stewardship.
I.)
AMAZONIAN DEFORESTATION
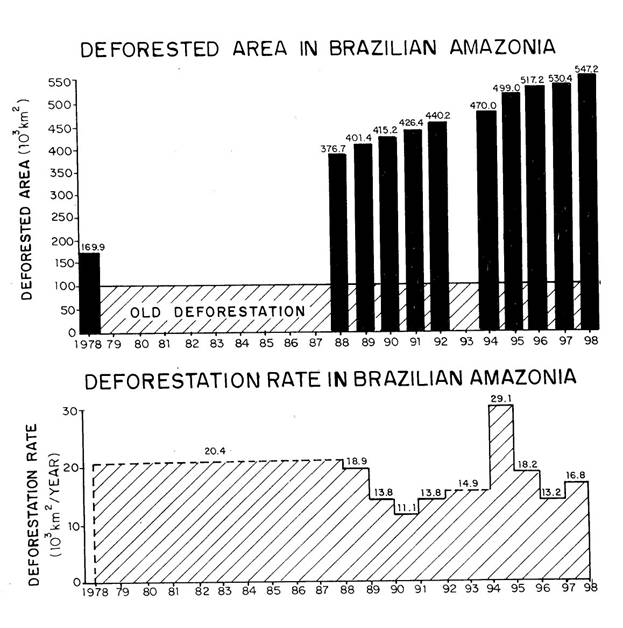
Deforestation data from LANDSAT-TM imagery,
released by Brazil's National Institute for Space Research (INPE) in January
1988, indicate that 530 X 103 km2 had been cleared by
1997 (Brazil, INPE, 1998). A preliminary
estimate indicates that the total reached 547 X 103 km2
by 1998 (Brazil, INPE, 1999). Brazil's 5
X 106 Legal Amazon region is approximately the size of western
Europe, and the area cleared by 1997 was the size of France. Approximately 4 X 10⁶ km2
of the Legal Amazon region was originally forested (the rest was originally
savanna, mainly cerrado). Of the
originally forested area, 13% had been cleared by 1997; 82% of the clearing had
taken place since construction of the Transamazon Highway marked the beginning
of modern development in the region in 1970.
Over the 9-year period from 1988 to 1997 the rate of forest loss
averaged 17.0 X 10³ km2/year, or 3.2 ha/minute.
Deforestation causes serious environmental
impacts such as loss of biodiversity, emission of greenhouse gases and loss of
water cycling. Human impacts include
disappearance of indigenous and other traditional peoples. The vast majority of deforested land is
converted to cattle pastures, either directly after felling (in the case of
large ranches) or after a brief period of use under annual cropping (in the
case of small farmers). The cattle
pastures degrade within about a decade; maintenance of pasture productivity by
applying fertilizers is possible, but, given limited phosphate deposits in
Brazil, this is unlikely for the vast areas now already cleared (Fearnside,
nd-a). Cattle pastures do little to
support the human population of the region.
Avoiding the impacts of deforestation, to be discussed in this paper, is
worth much more than the income that can be reasonably expected from activities
dependent on the soil, such as agriculture and ranching. The relative values of the costs and benefits
of deforestation provide the principal justification for shifting the basis of
development to environmental services, and to implanting programs to avert
further loss of forest.
A prerequisite to any program to slow
deforestation is that the causes driving it must be understood. Our knowledge of deforestation processes is
still imperfect; contributions to better understanding the process therefore
represent a key area in which effort is needed in order to avoid forest loss
and consequent greenhouse gas emissions.
A tremendous spectrum of opinion exists as to who is to blame for
deforestation in Brazilian Amazonia; however, these opinions vary equally
widely in the factual base supporting them.
Examination of several lines of available evidence indicates that
ranchers (both medium and large) are the main agents of clearing.
The relative weight of small farmers versus
large landholders in Brazilian Amazonia is continually changing as a result of
changing economic and demographic pressures.
The behavior of large landholders is most sensitive to economic changes
such as interest rates offered by money markets and other financial
investments, government subsidies for agricultural credit, rate of general
inflation, and changes in the price of land.
Tax incentives were a strong motive in the 1970s and 1980s. In June 1991, a decree suspended the granting
of new incentives. However, the
old (i.e., already approved) incentives continue to the present day,
contrary to the popular impression fostered by numerous statements by
government officials to the effect that incentives had ended. Many other forms of incentives, such as large
amounts of government-subsidized credit at rates far below those of Brazilian
inflation, became much scarcer after 1984.
Hyperinflation was the dominant feature of the
Brazilian economy for decades preceding the initiation of Brazil's "Plano
Real" economic reform program in July 1994. Land played a role as store of value, and its
value was bid up to levels much higher than what could be justified as an input
to agricultural and ranching production.
Deforestation played a critical role as a means of holding claim to land
(see Fearnside, 1987). Deforesting for
cattle pasture was the cheapest and most effective means of maintaining
possession of investments in land regardless of the reasons behind the
profitability of the ventures. The
extent to which the motive for defending these claims (through expansion of
cattle pasture) was speculative profits from increasing land value has been a
matter of debate. Hecht et al.
(1988) present calculations of the overall profitability of ranching in which
the contribution from speculation is critical, while Mattos and Uhl (1994) find
that actual production of beef has become increasingly more profitable, and
that supplementary income from selling timber (allowing investment in
recuperation of degraded pastures on the properties) is critical. Obviously, selling off the timber can only be
depended upon for a few years to subsidize the cattle-raising portion of the
operations, since the harvest rates are virtually always above sustainable
levels. Faminow (1998) analyzed land
price trends in Amazonia and concluded that speculative profits cannot explain
the attraction of capital to investments in Amazonian ranches (but see
Fearnside, 1999a for a rebuttal).
The decline in deforestation rates from
1987 through 1991 can best be explained by Brazil's deepening economic
recession over this period. Ranchers
simply did not have money to invest in expanding their clearings as quickly as
they had in the past. In addition, the
government lacked funds to continue building highways and establishing
settlement projects. Probably very
little of the decline can be attributed to Brazil's repression of deforestation
through inspection from helicopters, confiscating chainsaws and fining
landowners caught burning without the required permission from the Brazilian
Institute of Environment and Renewable Natural Resources (IBAMA). Despite bitter complaints, most people
continued to clear anyway. Changes in
policies on granting fiscal incentives also do not explain the decline. The decree suspending the granting of new
incentives (Decree No. 153) was issued on 25 June 1991--after almost all of the
observed decline in deforestation rate had already occurred (see Fig. 1). Even for the last year of the decline (1991),
the effect would be minimal, as the average date for the LANDSAT images for the
1991 data set was August of that year.
The low point in 1991 corresponds to the period affected by then-president
Fernando Collor de Mello's seizure of bank account balances in 1990.
[Figure 1 here]
The peak in 1995 is probably, in large
part, a reflection of economic recovery under the Plano Real, which resulted in
larger volumes of money suddenly becoming available for investment, including
investment in cattle ranches. The fall
in deforestation rates in the years after 1995 is a logical consequence of the
Plano Real having sharply cut the rate of inflation. Land values reached a peak in 1995, and subsequently
fell by about 50% by the end of 1997 (O Diário, 1998). Falling land values make land speculation
unattractive to investors. The
association of major swings in deforestation rate with macroeconomic factors
such as inflation rate and money availability is one indication that much of
the clearing is done by those who invest in medium and large cattle ranches,
rather than by small farmers using family labor.
The distribution of 1991 clearing among the
region's nine states indicates that most of the clearing took place in states
that are dominated by ranchers: the state of Mato Grosso alone accounted for
26% of the 11.1 X 10³ km2 total. Mato Grosso has the highest percentage of its
privately held land in ranches of 1000 ha or more: 84% at the time of the last
(1985) agricultural census. A moment's
reflection on the human significance of having 84% of the land in large ranches
(and only 3% in small farms) should give anyone pause. By contrast, Rondônia--a state that has
become notorious for its deforestation by small farmers who arrived on the
BR-364 highway that was paved by the World Bank's POLONOROESTE Project in the
early 1980s--accounted for only 10% of the 1991 deforestation total, while Acre
had 3%.
The number of properties censused in each size
class explained 74% of the variation in deforestation rate per area of private
land among the nine Amazonian states in both 1990 and 1991. Multiple regressions indicate that 30% of the
clearing in both 1990 and 1991 could be attributed to small farmers (properties
< 100 ha in area), and the remaining 70% to either medium or large ranchers
(Fearnside, 1993a). An additional
indication is that 79% of the area of new clearings in 1995 and 82% in 1996
were in clearings $15 ha in area. Small
farmer families are only capable of clearing about 3 ha/year with family labor
(Fearnside, 1980), and this is reflected in deforestation behavior in
settlement areas (Fearnside, 1984).
Understanding how deforestation works
requires quantitative estimates of the effects of the profitability of beef
production, the roles of land speculation and land prices, incentives, small
farmers, land reform, road building, logging, and soybeans. In addition, quantification is needed of
economic effects from changes in inflation rate, alternative investments
(discount rate), and the price and time for transport in different parts the
region.
What is needed are functional (causal)
models of deforestation that are disaggregated by socio-economic group and by
location within the Legal Amazon.
Simulations are needed with and without policies intended to reduce
deforestation, thereby allowing calculation of the difference between scenarios
for the same place.
II.)
DEFORESTATION IMPACTS
A.) LOSS OF BIODIVERSITY
Deforestation results in loss of
biodiversity because most tropical forest species cannot survive the abrupt
changes when forest is felled and cannot adapt to new conditions in the
deforested landscape. The high degree of
endemism, or presence of species that are only found within a small
geographical range, can result in loss of species and loss of genetic
variability within species even when the forest surrounding a cleared area
appears to human observers to be identical to the forest that was lost.
The impact of deforestation extends beyond
the area directly cleared because of edge effects and the impact of
fragmentation. When continuous forest is
divided into small islands they are unable to support viable populations of
forest species, including their biological interactions (see Laurance and
Bierregaard, 1997). In addition, fire
and other disturbance regimes (including logging) are usually associated with
the presence of nearby deforestation, thus further extending the impact beyond
the edges of the clearings.
The impact of converting forest to another
land use depends not only on the patch of land in question, but also on what
has been done with the remainder of the region.
As the cumulative area cleared increases, the danger increases that each
additional hectare of clearing will lead to unacceptable impacts. For example, the risk of species extinctions
increases greatly as remaining areas of natural forest dwindle.
Biodiversity has many types of value, from
financial value associated with selling a wide variety of products, to the use
value of the products, to existence values unrelated to any direct
"use" of a species and its products.
People disagree on what value should be attached to biodiversity,
especially those forms of value not directly translatable into traditional
financial terms by today's marketplace.
While some may think that biodiversity is worthless except for sale, it
is not necessary to convince such people that biodiversity is valuable; rather,
it is sufficient for them to know that a constituency exists today and is
growing, and that this represents a potential source of financial flows
intended to maintain biodiversity.
Political scientists estimate that such willingness to pay already
surpasses US$ 20/ha/year for tropical forest (Cartwright, 1985).
B.) GREENHOUSE GAS EMISSIONS
Brazil's official estimates of greenhouse
gas emissions have produced some extraordinarily low values. On the eve of the 1992 United Nations
Conference on Environment and Development (UNCED), or "ECO-92," in Rio
de Janeiro, INPE announced that Brazilian deforestation released only 1.4% of
the world's CO2 emissions (Borges, 1992), a value about three times
lower than those derived by this author (Fearnside, 1996a, 1997a). Such a low value was obtained by counting
only prompt emissions released through the initial burning of the forest,
ignoring decomposition and re-burns.
Only 39% of the gross release of above-ground carbon, or 27% of the
gross release of total carbon (including below-ground biomass and soil carbon)
occurs through this pathway for the CO2 component of net committed
emissions (Fearnside, 2000a, updated from Fearnside, 1997a).
On the eve of the 1997 conference of the
parties to the Framework Convention on Climate Change (FCCC), INPE announced that
Brazil releases zero net emissions from deforestation (ISTOÉ,
1997). This extraordinary conclusion was
apparently reached by ignoring all deforestation emissions other than the
initial burn, combined with the belief that the crops planted can somehow absorb
this amount of carbon. INPE claimed that
"the crops that grow wind up absorbing the carbon that was thrown into the
atmosphere by the burning" (ISTOÉ, 1997). Unfortunately, only 7% of the net committed
emissions of deforestation are reabsorbed by the replacement landscape
(Fearnside, 1997a; see also Fearnside and Guimarães, 1996).
Current estimates of the 1990 emission from
deforestation in the Brazilian Legal Amazon are given in Table 1 in terms of
net committed emissions and annual balance.
"Net committed emissions" refers to the long-term total of
emissions and uptakes set in motion by the act of deforestation, and is
calculated only for the area cleared in a given year (i.e., the 13.8 X
103 km2 cleared in 1990).
The "annual balance" refers to the emissions and uptakes in a
single year (i.e., 1990: the base year for national inventories under
the FCCC) over the entire landscape (the 415.2 X 10³ km2
cleared by 1990). Two scenarios are
given: "low" and "high" trace gas emissions. These represent a range of emissions factors,
or the amount of each gas emitted by different processes such as flaming and
smoldering combustion. The range of
doubt concerning other important processes, such as forest biomass and
deforestation rate at different locations, is not included. The annual balance was higher than the net
committed emissions in 1990 because deforestation rates had been higher in the
years immediately preceding this year, therefore leaving larger quantities of
unburned biomass to produce emissions in the years that followed. My current best estimate for 1990 (Table 1)
is 267 X 106 t C of net committed emissions and 353 X 106
t C of annual balance from deforestation, plus an additional 62 X 106
t C from logging (Fearnside, 2000a; see Fearnside, 1996a). Trace gases are accounted for using the
100-year integration global warming potentials adopted by the second assessment
report (SAR) of the Intergovernmental Panel on Climate Change (IPCC) (Schimel et
al., 1996). Only deforestation (that
is, loss of original forest, including both clearing and flooding by
hydroelectric dams) is given here, not loss of cerrado (the central
Brazilian scrubland that was the original vegetation in about 20% of the Legal
Amazon). The magnitude of these emissions
can be appreciated by comparison with global emissions from automobiles: the
400 million automobiles in the world emit 550 X 106 t of carbon
annually (Flavin, 1989). All human
activities in the 1980s emitted approximately 7.1 X 10⁹ t of carbon
yearly, 5.5 X 10⁹ t (77%) of which was from fossil fuel combustion
(Schimel et al., 1996: 79); this means that, while slowing deforestation
would be an important measure in combating global warming, it cannot eliminate
the need for major reductions in fossil fuel use in industrialized countries.
[Table 1 here]
Carbon storage as a means of avoiding
global warming through the greenhouse effect represents a major environmental
service of Amazonian forests. The way
that this benefit is calculated can have a tremendous effect on the value
assigned to maintaining Amazonian forest.
As currently foreseen in the FCCC, maintaining carbon stocks is not
considered a service--only deliberate incremental alterations in the flows of
carbon. Even considering only this much
more restrictive view of carbon benefits, the value of Amazonian forests is
substantial (Fearnside, 1999b).
Although a wide variety of views exists on
the monetary value of carbon, already enacted carbon taxes of US$ 45/t in
Sweden and the Netherlands and US$ 6.1/t in Finland indicate that the
"willingness to pay" for this service is already substantial. This willingness to pay may increase
significantly in the future when the magnitude of potential damage from global
warming becomes more apparent to decision-makers and the general public. At the level indicated by current carbon
taxes, the global warming damage of Amazon deforestation is already worth US$
1.6-11.8 billion/year. The value of the
global warming damage from clearing a hectare of forested land in Amazonia (US$
1,200-8,600) is much higher than the purchase price of land today. The calculations in the present paper use US$
7.3/t C as the value of permanently sequestered carbon (the "medium"
value from Nordhaus, 1991). It is highly
probable that willingness to pay to avoid greenhouse gas emissions will rise
dramatically as the magnitude and reality of global warming impacts becomes
increasingly evident to the general public and their political leaders. The IPCC currently uses an estimate that
doubling preindustrial atmospheric concentrations of CO2, expected
to occur by 2070 under a "business-as-usual" reference scenario,
would result in annual loss of 138,000 lives plus material damages of US$ 231
billion in 1990 values (Pearce et al., 1996: 197). These estimates assume that global population
and other parameters are frozen at their 1990 levels; the impacts on the much
larger human population and infrastructure inventory that are likely to exist
by the time of CO2 doubling would be much greater. It should be emphasized that these estimates
refer to annual impacts from that time forward, rather than to a
one-time event.
C.) LOSS OF WATER CYCLING
Water cycling is different from
biodiversity and carbon in that this impact of deforestation falls directly on
Brazil rather than being spread over the world as a whole. Several independent lines of evidence
indicate that about half of the rainfall in the Brazilian Amazon is water that
is recycled through the forest, the rest originating from water vapor blown
into the region directly from the Atlantic Ocean (Shukla et al.,
1990). Because recycled water represents
50%, the volume of water involved is the same amount as one sees flowing in the
Amazon River. The Amazon is by far the
world's largest river in terms of water flow--over eight times larger than the
second largest, Africa's Congo River, and 17 times larger than the
Mississippi/Missouri system in North America.
Part of the water vapor is transported by winds from Amazonia to Brazil's
Central-South Region, where most of the country's agriculture is located. Brazil's annual harvest has a gross value of
about US$ 65 billion, and dependence of even a small fraction of this on
rainfall from Amazonian water vapor would translate into a substantial value
for Brazil. Although movement of the
water vapor is indicated by global circulation models (Eagleson, 1986; Salati
and Vose, 1984), the amounts involved are as yet unquantified.
The role of Amazonian forest in the
region's water cycle also implies increasing risk with the scale of
deforestation. The critical period is
the dry season, making annual totals deceptive.
While annual rainfall would decline by only 7% from conversion of all
forest to pasture, the change in the month of August would be approximately 32%
(Lean et al., 1996: 560-561).
When rainfall reductions caused by losses of forest evapotranspiration
are added to the high natural variability that characterizes rainfall in the
region, the resulting droughts are likely to cross biological thresholds
leading to major impacts (Fearnside, 1995).
These thresholds include the drought tolerance of individual tree
species and the increased probability of fire being able to propagate itself in
standing forest. Fire entry into standing
forest in Brazilian Amazonia already occurs in areas disturbed by logging (Uhl
and Buschbacher, 1985; Uhl and Kauffman, 1990).
During the El Niño drought of 1997/1998, over 11,000 km2 of
undisturbed forest burned in Brazil's far northern state of Roraima (updated
from Barbosa, 1998). El Niños can be
substantially more severe than the 1997/1998 event: "mega-El Niño"
events have caused widespread conflagrations in the forest in Amazonia four
times over the past 2000 years (Meggers, 1994).
The effect of large-scale deforestation is to turn relatively rare
events like these into something the functional equivalent of which could recur
at much more frequent intervals. The
presence of ranches and settlements spread throughout the region now provides
greatly increased opportunities for fire initiation whenever the forest is dry
enough to burn. The environmental price
of deforestation is no longer restricted to the forest felled directly, but
must also include the risk of losing adjacent forested areas to fire.
III.)
ENVIRONMENTAL SERVICES
Environmental services can be estimated in
a variety of ways, depending on the purposes for which the results are
intended. Estimates of the replacement
cost of services results in astronomical figures that are valuable in awakening
awareness among the public and decision-makers regarding the wisdom of
maintaining remaining natural ecosystems (e.g., Costanza et al.,
1997; Pimentel et al., 1997). The
value of environmental services in terms of willingness to pay is inevitably
much lower than any measure of the "true" value of the services, such
as replacement value. Estimates of
willingness to pay are needed in order to provide a starting point for
considering the potential of monetary flows based on environmental services as
a means of maintaining both the forest and the people in rural Amazonia.
That willingness to pay for environmental
services already greatly exceeds what can be derived from selling timber and
converting Amazonian forest to ranching or agriculture is obvious from
comparison of willingness to pay indicators with land prices in the
region. The proposal is not to
buy land, but land prices are useful as reflections of the net present value of
what can be obtained from land-use options open to those purchasing land. Prices of forested land were approximately
US$ 300/ha prior to Brazil's July 1994 Plano Real economic reform program, and
fell to approximately US$ 150/ha by the end of 1997. Just the value of carbon storage (at US$
7.3/t C permanently sequestered) is approximately 10 times greater than the
1997 land price. Devaluation of the real
in 1999 has further increased this gap.
The value of environmental services can be
calculated in several illustrative ways (Table 2, from Fearnside, 2000b, updated
from Fearnside, 1997b). One way is to
compute the damage caused by the 13.8 X 10³ km2 of
deforestation that occurred in 1990.
This has a net present value (at 5% discount) of US$ 3 billion. This would be the annual value of
refraining from deforestation, if one assumes that deforestation would
otherwise proceed at a constant rate equal to that in 1990. The net present value of 1990 and all future
damage (i.e., the one-time value of a commitment to refrain indefinitely
from further deforestation) would be US$ 60.8 billion. These ways of calculating values correspond
to the net incremental costs approach presently recognized under the FCCC. Much higher values result from considering
the stocks of environmental services (rather than the increments to the flows),
especially in the case of carbon. The
total net present value of Amazonia's environmental stocks is US$ 742 billion,
or US$ 37 billion per year if annualized at 5%.
[Table 2 here]
The tropical forest portion of the global carbon
stocks is estimated at 195.8 X 10⁹ t C, which, together with the
18.3 X 10⁹ t C of "at risk" soil carbon, less 17.4 X 10⁹
t C in the landscape that would replace tropical forests, would bring the total
tropical forest carbon stock requiring maintenance to 216.8 X 10⁹ t
C. Conversion of Brazil's Amazon forest
to a replacement landscape reflecting current trends (Fearnside, 1996b) would
release an estimated 76.9 X 10⁹ t C, or 31% of the total potential
net release from the world's tropical forests (Fearnside, nd-b).
The degree of certainty that can be
attached to these estimates of environmental impacts varies considerably, and
in no case is it satisfactory. Despite
wide ranges of uncertainty regarding greenhouse gas emissions, this is probably
the impact for which quantification is best.
It is important to realize that the range of numbers appearing in the
literature greatly exceeds the range of real scientific doubt, since a number
of the estimates in the literature contain known errors (see reviews in
Fearnside, 1990a, 1993a,b, 1997c for deforestation; Fearnside, 1994 for
biomass; Fearnside, 1996b for replacement vegetation; Fearnside and Barbosa,
1998 for soil carbon and Fearnside, 1997a for net committed emissions
calculations). For biodiversity the
numbers are soft both for the physical impacts and for willingness to pay. The problem of scale is likely to be most
restrictive for this environmental service, as the global total that society is
willing to pay to maintain biodiversity might well be exhausted when
per-hectare values are extrapolated to the scale of Amazonia (see Fearnside,
1997b). For water cycling, while
significant progress has been made on estimating potential rainfall reduction
in the Amazon region, little has been done to quantify the amount of water
transported to agricultural areas in other parts of Brazil, the effect of
transported water vapor on rainfall and the expected impact on yields. Despite the unsatisfactory state of our knowledge,
we must act on the best currently available information in all of
these areas. Postponing action pending
endless "further studies" is a sure formula for disaster. The basic outline of the problem--namely that
widespread deforestation would bring tremendous impacts that must be avoided--is
not likely to change as research progresses.
The rest is details.
IV.)
THE INTERNATIONAL COMMUNITY
The international community can make
important contributions, both through its wealth and its intellectual and
technical capabilities. The first and most
obvious thing that individuals and governments outside Amazonia can do,
especially in the industrialized nations, is to refrain from practices that
encourage deforestation (Fearnside, 1990b).
These include providing markets for uncertified timber and other
products and investment in and management of multinational corporations and
their Brazilian subsidiaries that carry out damaging activities. Industrialized countries contribute most of
the funds loaned by the World Bank and the Interamerican Development Bank, and
consequently these countries have the most say in how the money is used. These multilateral development banks are a
major force in Amazonian development, and can have a great effect, either for
good or for evil, depending on the policies under which they operate.
Positive contributions can be made in
scientific collaboration and in training.
The Anglo-Brazilian climate study (Abracos) and the Biomass and
Nutrients (Bionte) project, and the Large-Scale Atmosphere-Biosphere (LBA)
project provide examples, particularly the first two. Much more of the intellectual activity in
Amazonian research must take place within the region itself, rather than
elsewhere in Brazil or abroad. While
contributions from abroad can help, in the final analysis Amazonian forest and
the peoples and programs that sustain it will either stand or fall based on
decisions that are made locally--not in Brasília or abroad.
Research and money are not the only ways in
which the international community needs to contribute to making environmental
services into a form of sustainable development for Amazonia. Much needs to be done in designing channels
for funds and in monitoring and assessing how the funds are used and how the
environmental and social objectives of funding programs are attained. The international community is often shy
about this role due to the unfortunate effect of occasional naïve and stupid
statements by foreigners offensive to Brazilian sovereignty, thereby providing
rhetorical firepower for political and financial interests in Brazil that are
anxious to avert any restrictions on development plans. As a result, it is not uncommon to see
foreigners afraid to stick to their guns in insisting on appropriate safeguards
against environmental and social impacts.
When projects are financed from abroad, those whose taxes or other
contributions are used in the projects have both the right and the duty to see
that their money is used in environmentally and socially responsible ways. Reorienting development to a role of
environmental stewardship is very much in the interests of the Brazilian
nation, the international community, and local peoples in Amazonia.
V.)
ACKNOWLEDGMENTS
I thank the National Council of Scientific
and Technological Development (CNPq AI 350230/97-98) and the National Institute
for Research in the Amazon (INPA PPI 5-3150) for financial support. S.V. Wilson commented on the manuscript.
VI.)
LITERATURE CITED
Barbosa,
R.I. 1998. Avaliação preliminar da área dos sistemas naturais e agroecossistemas
atingida por incêndios no Estado de Roraima (01.12.97 a 31.03.98). Instituto Nacional de
Pesquisas da Amazônia/Núcleo de Pesquisas de Roraima. Boa Vista, Roraima,
Brazil. 18 pp.
Borges, L. 1992. "Desmatamento
emite só 1,4% de carbono, diz Inpe" O Estado de São Paulo 10 April
1992, p. 13.
Brazil, INPE. 1998. Amazonia:
Deforestation 1995-1997. Instituto Nacional de Pesquisas Espaciais (INPE),
São José dos Campos, São Paulo, Brazil. Document released via internet
(http://www.inpe.br).
Brazil, INPE. 1999. Monitoramento
da Floresta Amazônica Brasileira por Satélite/ Monitoring of the Brazilian
Amazon Forest by Satellite: 1997-1998. Instituto Nacional de Pesquisas
Espaciais (INPE), São José dos Campos, São Paulo, Brazil. Document released via internet (http://www.inpe.br).
Cartwright,
J. 1985. The politics of preserving natural areas in Third World states. The
Environmentalist 5(3): 179-186.
Costanza,
R., R. d'Arge, R. de Groot, S. Farber, M. Grasso, B. Hannon, K. Limburg, S. Naeem,
R.V. O'Neill, J. Paruelo, R.G. Raskin, P. Sutton and M. van den Belt. 1997. The
value of the world's ecosystem services and natural capital. Nature 387: 253-260.
O Diário [Mogi das Cruzes]. 25
January 1998. "Preços das terras estão caindo, afirma FGV." p. 5.
Eagleson,
P.S. 1986. The emergence of global-scale hydrology. Water Resources Research
22(9): 6s‑14s.
Faminow,
M.D. 1998. Cattle, Deforestation and Development in the Amazon: An Economic
and Environmental Perspective. CAB International, New York, U.S.A. 253 pp.
Fearnside,
P.M. 1980. Land use allocation of the Transamazon Highway colonists of Brazil
and its relation to human carrying capacity. pp. 114-138 In: F.
Barbira-Scazzocchio (ed.). Land, People and Planning in Contemporary
Amazonia. University of Cambridge Centre of Latin American Studies
Occasional Paper No. 3, Cambridge, U.K. 313 pp.
Fearnside,
P.M. 1984. Land clearing behaviour in small farmer settlement schemes in the
Brazilian Amazon and its relation to human carrying capacity. pp. 255-271 In:
A.C. Chadwick and S.L. Sutton (eds.). Tropical Rain Forest: The Leeds
Symposium. Leeds Philosophical and Literary Society, Leeds, U.K. 335 pp.
Fearnside,
P.M. 1987. Causes of Deforestation in the Brazilian Amazon. pp. 37-61 In: R.F.
Dickinson (ed.) The Geophysiology of Amazonia: Vegetation and Climate
Interactions. John Wiley & Sons, New York, U.S.A. 526 pp.
Fearnside,
P.M. 1990a. The rate and extent of deforestation in Brazilian Amazonia. Environmental
Conservation 17(3): 213-226.
Fearnside,
P.M. 1990b. Practical Targets for Sustainable Development in Amazonia. pp.
167-174 In: N. Polunin and J. Burnett (eds.) Maintenance of the Biosphere:
Proceedings of the Third International Conference on the Environmental Future.
Edinburgh University Press, Edinburgh, U.K. 224 pp.
Fearnside,
P.M. 1993a. Deforestation in Brazilian Amazonia: The effect of population and
land tenure. Ambio 22(8): 537-545.
Fearnside, P.M. 1993b. Desmatamento
na Amazônia: Quem tem razão--o INPE ou a NASA? Ciência Hoje 16(96): 6-8.
Fearnside, P.M. 1994. Biomassa das
florestas Amazônicas brasileiras. pp. 95-124 In: Anais do Seminário Emissão
X Seqüestro de CO2. Companhia Vale do Rio Doce (CVRD), Rio de
Janeiro, Brazil. 221 pp.
Fearnside,
P.M. 1995. Potential impacts of climatic change on natural forests and forestry
in Brazilian Amazonia. Forest Ecology and Management 78: 51-70.
Fearnside,
P.M. 1996a. Amazonia and global warming: Annual balance of greenhouse gas
emissions from land-use change in Brazil's Amazon region. pp. 606-617 In: J.
Levine (ed.) Biomass Burning and Global Change. Volume 2: Biomass Burning in
South America, Southeast Asia and Temperate and Boreal Ecosystems and the Oil
Fires of Kuwait. MIT Press, Cambridge, Massachusetts, U.S.A. 902 pp.
Fearnside,
P.M. 1996b. Amazonian deforestation and global warming: Carbon stocks in vegetation replacing
Brazil's Amazon forest. Forest Ecology and Management 80: 21-34.
Fearnside,
P.M. 1997a. Greenhouse gases from deforestation in Brazilian Amazonia: Net
committed emissions. Climatic Change 35(3): 321-360.
Fearnside,
P.M. 1997b. Environmental services as a strategy for sustainable development in
rural Amazonia. Ecological Economics 20(1): 53-70.
Fearnside,
P.M. 1997c. Monitoring needs to transform Amazonian forest maintenance into a
global warming mitigation option. Mitigation and Adaptation Strategies for
Global Change 2(2-3): 285-302.
Fearnside,
P.M. 1999a. "Cattle, Deforestation and Development in the Amazon: An
Economic, Agronomic and Environmental Perspective" by Merle D. Faminow. Environmental
Conservation 26(3): 238-240
Fearnside,
P.M. 1999b. Forests and global warming mitigation in Brazil: Opportunities in
the Brazilian forest sector for responses to global warming under the
"Clean Development Mechanism." Biomass and Bioenergy 16:
171-189.
Fearnside, P.M. 2000a. Greenhouse gas emissions from land use change in Brazil's Amazon region. pp. 231-249. In: R. Lal, J.M. Kimble and B.A. Stewart (eds). Global Climate Change and Tropical Ecosystems. Advances in Soil Science. CRC Press, Boca Raton, Florida, U.S.A. 438 pp.
Fearnside,
P.M. 2000b. Environmental services as a strategy for sustainable development in
rural Amazonia. In: C. Cavalcanti (ed.) The Environment, Sustainable
Development and Public Policies: Building Sustainability in Brazil. Edward
Elgar, Cheltenham, U.K. (in press).
Fearnside,
P.M. nd-a. Fragile soils and deforestation impacts: The rationale for
environmental services of standing forest as a development paradigm in
Amazonia. Paper presented at the International Conference on Human Impacts on
the Environments of Brazilian Amazonia: Does Traditional Knowledge have a Role
in the Future of the Region?, Centre for Brazilian Studies, Linacre College,
Oxford University, Oxford, U.K., 5-6 June 1998. (forthcoming).
Fearnside, P.M. nd-b. Global warming and tropical land-use
change: Greenhouse gas emissions from biomass burning, decomposition and soils
in forest conversion, shifting cultivation and secondary vegetation. Climatic
Change (in press).
Fearnside,
P.M. and R.I. Barbosa. 1998. Soil carbon changes from conversion of forest to
pasture in Brazilian Amazonia. Forest
Ecology and Management 108(1-2): 147-166.
Fearnside,
P.M. and W.M. Guimarães. 1996. Carbon uptake by secondary forests in Brazilian
Amazonia. Forest Ecology and Management 80(1-3): 35-46.
Flavin,
C. 1989. Slowing global warming: A worldwide strategy. Worldwatch Paper 91.
Worldwatch Institute, Washington, DC, U.S.A. 94 pp.
Hecht,
S.B., R.B. Norgaard and C. Possio. 1988. The economics of cattle ranching in
eastern Amazonia. Interciencia 13(5): 233-240.
ISTOÉ. 1997. "A versão do
Brasil" ISTOÉ [São Paulo], 15 October 1997, p. 98.
Laurance,
W.F. and R.O. Bierregaard, Jr. (eds.) 1997. Tropical Forest Remnants:
Ecology, Management, and Conservation of Fragmented Communities. University
of Chicago Press, Chicago, Illinois, U.S.A. 616 pp.
Lean,
J., C.B. Bunton, C.A. Nobre and P.R. Rowntree. 1996. The simulated impact of
Amazonian deforestation on climate using measured ABRACOS vegetation
characteristics. pp. 549-576 In: Gash,
J.H.C., C.A. Nobre, J.M. Roberts and R.L. Victoria (eds.) Amazonian Deforestation and Climate.
Wiley, Chichester, U.K. 611 pp.
Mattos,
M.M. and C. Uhl. 1994. Economic and ecological perspectives on ranching in the
Eastern Amazon. World Development 22(2): 145-158.
Meggers,
B.J. 1994. Archeological evidence for the impact of mega-Niño events on
Amazonia during the past two millenia. Climatic Change 28(1-2): 321-338.
Nordhaus,
W. 1991. A sketch of the economics of the greenhouse effect. American
Economic Review 81(2): 146-150.
Pearce,
D.W., W.R. Cline, A.N. Achanta, S. Fankhauser, R.K. Pachauri, R.S.J. Tol and P.
Velinga. 1996. The social costs of climate change: Greenhouse damage and the
benefits of control. pp. 179-224 In:
J.P. Bruce, H. Lee and E.F. Haites (eds.) Climate Change 1995: Economic and
Social Dimensions--Contributions of Working Group III to the Second Assessment
Report of the Intergovernmental Panel on Climate Change. Cambridge
University Press, Cambridge, U.K. 448 pp.
Pimentel,
D., Wilson, C., McCullum, C., Huang, R., Dwen, P., Flack, J. Tran, Q., Saltman,
T and Cliff, B. 1997. Economic and environmental benefits of biodiversity. BioScience
47(11): 747-757.
Salati,
E. and P.B. Vose. 1984. Amazon Basin: A system in equilibrium. Science
225: 129-138.
Schimel,
D. and 75 others. 1996. Radiative forcing of climate change. pp. 65-131 In:
J.T. Houghton, L.G. Meira Filho, B.A. Callander, N. Harris, A. Kattenberg and
K. Maskell (eds.) Climate Change 1995: The Science of Climate Change.
Cambridge University Press, Cambridge, U.K. 572 pp.
Shukla,
J., C. Nobre and P. Sellers. 1990.
Amazon deforestation and climate change. Science 247: 1322-1325.
Uhl, C.
and R. Buschbacher. 1985. A disturbing synergism between cattle-ranch burning
practices and selective tree harvesting in the eastern Amazon. Biotropica 17(4): 265-268.
Uhl, C.
and J.B. Kauffman. 1990. Deforestation, fire susceptibility, and potential tree
responses to fire in the Eastern Amazon. Ecology 71(2): 437-449.
FIGURE LEGEND
Figure 1 -- Rate and extent of deforestation in the
Brazilian Legal Amazon (data from Brazil, INPE, 1998, 1999, with adjustments to
1978-1988 rates as described in Fearnside, 1993b).
|
TABLE 1: COMPARISON OF METHODS OF CALCULATING THE
1990 GLOBAL WARMING IMPACT OF DEFORESTATION IN ORIGINALLY FORESTED AREAS IN
BRAZILIAN AMAZONIA IN MILLIONS OF TONS OF CO2-EQUIVALENT CARBON |
|
||||||
|
|
|
||||||
|
Scenario |
Gases included |
Net committed emissions (Defores- tation only) (a,b) |
Annual balance |
|
|||
|
|
|
|
Deforest-ation (b) only |
Logging |
Deforest-ation (b) + logging |
||
|
|
|
||||||
|
Low trace gas |
CO2 only |
255
|
329 |
61 |
390 |
||
|
|
|
|
|
|
|
||
|
|
CO2, CH4, N2O
(c) |
267 |
354 |
62 |
416 |
||
|
|
|
|
|
|
|
||
|
High trace gas |
CO2 only |
255 |
324 |
61 |
385 |
||
|
|
|
|
|
|
|
||
|
|
CO2, CH4, N2O
(c) |
278 |
358 |
62 |
421 |
||
|
|
|
||||||
|
(a) Infinite time horizon for fluxes from
biomass, soil C and replacement vegetation uptake; 100-year time horizon for recurrent
fluxes (cattle, pasture soil N2O, hydroelectric CH4 and
losses of intact forest sources and sinks); 100-year non-coterminous time
horizons for impacts; no discounting. |
|
||||||
|
(b) For clearing in originally forested areas only
(does not include cerrado clearing) |
|
||||||
|
(c) CO, NOx and NMHC are also
included in the analysis, but the IPCC SAR global warming potentials for
these gases are equal to zero. |
|
||||||
TABLE 2: SUMMARY OF “”MEDIUM”” ESTIMATES
OF FOREST VALUE
Description Units Biodiversity Carbon Water Total Note
Damage per ha forest loss Annual value US$/ha/yr 20 71 19 110
(a)
NPV US$/ha 400 1413 385 2198 (b)
All 1990 damage NPV US$
million 552 1950 531 3034 (b)
NPV/family US$/family 434 1532 417 2383
(c)
1990 and all future damage NPV US$
billion 11.1 39 10.7 60.8 (b,d)
from total population
NPV/family. US$
thousand/family 9 31 8 48 (b,d)
Annual
value US$
million/yr 554 1950 533 3098 (e)
Valor/yr/family US$/family/yr 435 1532 419 2387
(e)
Value of forest stock Total
NPV US$
billion 135 477 130 742 (b)
Annual
value US$
billion/yr 7 24 7 37 (e)
Value/yr/family US$
thousand/family/yr 5 19 5 29 (e)
(a) Value of carbon and permanent sequestration
annualized at 5%/yr.
(b) Biodiversity and water values are
net present value (NPV).
(c) Carbon value same as NPV.
(d) Assuming no population growth
either in total or small farmer population, with deforestation remaining at
1990 rate for 100 years.
(e) At 5%/yr interest.