INTRODUCTION
Deforestation in Brazil already makes a significant contribution to the global load of greenhouse gas (GHG) emissions, and complete or nearly complete replacement of Brazil's Amazon forest by pasture would both contribute to global warming and greatly reduce evapotranspiration in the region. Amazonian forests originally occupied 4 X 10⁶ km2 of the 5 X 10⁶ km2 Legal Amazon Region that comprises 60% of Brazil (Figure 1). The originally forested area is defined by 19 of the 28 vegetation types appearing in the Legal Amazon in Brazil's 1:5,000,000 scale vegetation map (Brazil, IBGE and IBDF, 1988; see Fearnside and Ferraz, 1995). "Deforestation" refers to clearing of these original forests, as distinguished from clearing secondary forests and from clearing savannas such as the cerrado (central Brazilian scrubland). Estimates of the impact of deforestation have usually assumed that all deforested land is converted to cattle pasture (the dominant land use in deforested areas in Brazilian Amazonia). Some have even assumed that forest is replaced with bare ground. Pasture is often assumed to remain indefinitely as replacement for forest in estimates of net GHG emissions (e.g. Fearnside, 1985a, 1987, 1991; Houghton, 1991; Myers, 1989), and in simulations of impact on the water cycle (e.g. Shukla et al., 1990) and of the less-threatening changes in surface albedo (Dickinson and Henderson-Sellers, 1988).
(Figure 1 here)
Detwiler and Hall (1988) assumed a replacement vegetation carbon stock of 5 t ha-1 (equivalent to approximately 11 t ha-1 of biomass) calculated by Hall et al. (1985: 317) from data on pasture by Buschbacher (1984) and on slash-and-burn agriculture by Uhl et al. (1982). The Detwiler and Hall (1988) study, together with studies by Houghton et al. (1985, 1987, 1988) that assumed the same 5 t ha-1 replacement vegetation carbon stock, provided the basis of the value for GHG emissions from tropical deforestation adopted by the Intergovernmental Panel for Climate Change (IPCC). The 1.6 gigaton (Gt=109 t) C year-1 IPCC value (Watson et al., 1990, p. 17) was chosen as the midpoint of the 0.6-2.5 Gt C year-1 range calculated in these studies (Watson et al., 1990, p. 11). This value remained unchanged in the 1992 supplementary report (Watson et al., 1992, p. 33) and 1994 IPCC report (Houghton et al., 1995, p. 18) that provide the current basis for international negotiations related to implementation of the Framework Convention on Climate Change.
Although the results of calculations that assume that all replacement vegetation is either cattle pasture or fields under annual crops in slash-and-burn cultivation are useful in identifying potential consequences of continued deforestation, they are unrealistic as quantitative predictions of contributions to climatic changes. The principal reason for using cattle pasture as the replacement vegetation has been the lack of more realistic scenarios for changes in the landscape after its initial conversion from forest to pasture. Here a first approximation is made using a simple first-order Markov model of transition probabilities between land-use classes.
Brazilian Amazonia already has a substantial area of deforested land. In 1990 there were 415.2 X 10³ km2 deforested, including 4.8 X 10³ km2 flooded by hydroelectric dams. By 1991 (the most recent year for which LANDSAT satellite data have been interpreted), the total had reached 426.4 X 10³ km2 (with the hydroelectric area unchanged from the preceding year) (Fearnside, 1993). The magnitude of the carbon stock in this area, and the way in which this stock can be expected to change over time, have important implications for the region's carbon balance and the net contribution of deforestation to global warming.
THE LANDSCAPE IN 1990
For use in carbon calculations of different types, the nature of the vegetation replacing forest must be known at different dates. For calculations of annual carbon balance in a given year, such as 1990, composition of the landscape in that year must be known. Ideally, the 1990 composition of the landscape should be determined from a survey using satellite imagery, including extensive field checking to identify secondary forests of different age classes and origins. Unfortunately, this kind of information does not exist, and the best available substitute must be used. Here the 1990 landscape composition is calculated based on a rough approximation of the 1970 landscape, and on information regarding deforestation rates and transitions among the various land-use categories in the deforested portion of the region.
The values for each land use in the initial year (1970) are mostly educated guesses. The lack of finer estimates for the areas in the 1970 landscape is not a serious problem for the present calculation, as these quantities have little effect on the composition of the landscape 20 years later. The percentages of the 1970 deforested landscape assumed for the different land-use categories (which are further subdivided by age class) were: 0% regenerated 'forest' (over 100 years old), 2.0% farmland, 10.0% productive pasture, 0% degraded pasture, 4.8% secondary forest derived from agriculture, 0.1% secondary forest derived from pasture, and 83.1% pre-1970 secondary forest.
The fate of land that is cleared can be approximated using information on the behavior of farmers and ranchers in Amazonia today. The consequences of continuation of the same patterns can be calculated using a Markov matrix of transition probabilities between land-use categories. Such an analysis carries with it the assumption that the transition probabilities remain unaltered over time--something for which there is no guarantee in practice. However, in most agricultural systems the tendency of increased population pressure and increased use intensity over time has been to shorten periods in secondary forest, with resulting lower average biomass for the landscape (e.g. UNESCO/UNEP/FAO, 1978; Vermeer, 1970). The assumption of constant transition probabilities therefore is conservative from the point of view of GHG emissions.
The 'typical behavior' in the region (a mix of small farmers and ranchers) can be described as follows. Annual crops are usually cultivated for only two years in a cropping cycle. Of the areas cleared from forest, about 20% are planted to annual crops and 80% directly to pasture (assumed to be 10% and 90%, respectively, for ranchers). Of farmland reaching the end of a cropping period, about 20% is allowed to revert to secondary forest and 80% is planted to pasture (assumed to be 10% and 90%, respectively, for ranchers). The average time that six secondary forest sites in the Transamazon Highway colonization area had been used as pasture prior to reverting to woody vegetation was 8.8 years (Guimarães, 1993, p. 17). The time of 'abandonment' of a pasture is defined as the time of the last burn rather than the time the last head of cattle is removed. The mean age of secondary forest from pasture at the time of clearing refers only to secondary forest over three years old at the time of clearing, as cutting of those three or less years old is considered as part of pasture maintenance. About 90% of abandoned pastureland becomes woody secondary forest, the remaining 10% becoming unproductive grassland (assumed only to apply to ranchers); this is admittedly a guess, but reflects the impression that deflection to degraded pasture occurs in a small (but still important) fraction of cases. Woody secondary forest stands (capoeira) from abandoned pastures are cleared after an average of 5.2 years, considering only the six cases with secondary forests over three years of age in the study done in 1991 on the Transamazon Highway (Guimarães, 1993, p. 17).
Abandonment of agricultural land to fallow is defined by the harvest of the last annual crop. Secondary forest stands are not left for the 20- to 30-year fallow periods that characterize traditional shifting cultivation (see Fearnside, 1985b). During the first six years of settlement on the Transamazon Highway (1970-1976), colonists near Altamira cleared secondary forests two years old or less with such high frequency that fallows of the average length assumed here would be a rarity had the farmers' behavior remained unchanged (Fearnside, 1984, 1986).
'Reclaiming' degraded grasslands to reform pastures takes place in about 10% of an area over a period of approximately 15 years, based on land-use histories surveyed by Uhl et al. (1988) in Paragominas: this corresponds to an annual probability of 0.007. A degraded grassland is assumed to take an average of 13 years to be transformed into secondary forest. The combination of pasture recovery and reversion to secondary forest implies a mean residence time in the 'degraded pasture' category of about 14 years. After 100 years, a secondary forest is considered mature forest again (from the point of view of biomass). This is conservative, given that very old secondary forest in Venezuela that did not start as degraded pasture is estimated to take 140 to 200 years to recover the biomass stock of primary forest (Saldarriaga et al., 1986, p. 122).
An earlier calculation used the above observations (with the exception of those from Guimarães, 1993) to generate an equilibrium landscape and estimate its carbon stock and uptake (Fearnside, 1992). The number of land-use categories has been increased in the present study, age structure has been added, and several values used for transition probabilities have been changed to reflect new information on land use in the region (in general indicating greater areas of secondary forest than previously thought).
Two recent studies of satellite imagery provide a means of estimating transition probabilities between secondary forest, farmland and pasture in small-farmer settlement areas. The first is a study of LANDSAT‑TM imagery for 1985 and 1991 for the area of Altamira, Pará (Moran, 1993; Moran et al., 1994). The second is a study of SPOT imagery from a 6420 km2 area in Rondônia (Skole et al., 1994). Probabilities calculated from these results are summarized in Table 1.
(Table 1 here)
Projecting the landscape in the region as a whole requires weighted averages of probabilities for small farmers and ranchers. Small farmers (defined as having up to 100 ha of land) accounted for 30.5% of the deforestation activity in the Brazilian Legal Amazon as a whole in 1990, while ranchers accounted for 69.5% (Fearnside, 1993). Unfortunately, less information is available on the behavior of cattle ranchers than small farmers.
For small farmers, the probabilities from each of two 'eastern' Altamira data sets (Moran et al., 1994), denominated 'km 23' and 'km 46,' were calculated using a phased sequence of iterative adjustments, as explained below. Probabilities of cutting secondary forest (for use as either farmland or pasture) were fitted at the highest level of generality, with transitions between only two states: active use and secondary forest. Annual probabilities were selected that minimize the difference between the predicted and observed landscape composition at the end of the observation interval. Constrained by these results, probabilities were then fitted at the next higher level of detail, with separate categories for farmland and pasture. This was done by first fitting the proportion of the secondary-forest-to-active-use transitions that went to farmland, followed by fitting the probabilities of transition from farmland to secondary forest, pasture to secondary forest, and pasture to farmland. Additional probabilities from Rondônia (Skole et al., 1994) were averaged with the 'eastern' Altamira values to produce a mean for small farmers (see Table 1).
For ranchers, appropriate data are lacking for the approach outlined above for the small farmer case. One data set that might be partially applicable is an area studied by Moran et al. (1994) in 'western' Altamira that includes some ranchers (along with small farmers). However, when probabilities were calculated from this data set using the procedure outlined above, the results were so at odds with more general information about land use patterns in the region that it was judged more reliable to use the 'typical behavior' of ranchers described earlier as the basis for long-term projections. The 1985-1991 'western' Altamira data imply an average 'active use' period of only 1.3 years--not a viable pattern for a ranching system. The 8.8-year average period of pasture use found by Guimarães (1993, p. 17) among colonists 50 km west of Altamira appears more representative. The transition probability values used for ranchers, together with their sources, are included in Table 2.
(Table 2 here)
The probabilities obtained from the procedures described above imply that secondary forests derived from agriculture and from pasture in the region as a whole (including both small farmers and ranchers, but excluding pre-1970 secondary forest) are cleared after average fallows of 5.2 and 6.2 years, respectively; these values are higher than the value of 4 years used previously (Fearnside, 1992).
CALCULATION OF CHANGES IN THE LANDSCAPE
Annual probabilities of each transition can be organized into a matrix, with initial states as rows and ending states as columns. Annual probabilities of transition and mean residence times in different land-use categories (states) are shown in Table 3. Annual probabilities used in the regional calculation are weighted for small farmers (30.5% of clearing) and ranchers (69.5% of clearing). Annual probabilities of transition for the regional calculation are summarized in Figure 2 for land that is deforested (modified from Fearnside, 1989a). This applies to land that was once original forest that had been cleared by 1990 (410.4 X 10³ km2, excluding hydroelectric dams).
(Table 3 and Figure 2 here)
The matrix for the regional calculation (Table 3) is transposed and multiplied by a column vector representing the initial area (in hectares) of each land use, plus the deforested area in the following year placed in the 'forest' category. The vector resulting from multiplication of these represents the land use the following year. The deforestation in the following year is then added to the vector (in the 'forest' position), which can then be allocated appropriately when the succeeding year's land uses are calculated.
THE EQUILIBRIUM REPLACEMENT VEGETATION LANDSCAPE
Exponentiation of the matrix of annual transition probabilities (Table 4) yields a vector representing the proportion of land in each category after establishment of equilibrium (Jeffers, 1978, pp. 92-97). Performing these calculations indicates that the equilibrium landscape would contain 0.0% regenerated forest, 4.0% farmland, 43.8% productive pasture, 5.2% degraded pasture, 2.0% secondary forest derived from agriculture, and 44.9% secondary forest derived from pasture (Table 4).
(Table 4 here)
The above calculations only refer to land that is cleared for agriculture and ranching. Hydroelectric development also removes forest land. All of the hydroelectric dams planned in Amazonia would total 100,000 km2 (Brazil, ELETROBRÁS, 1987, p. 150). This would represent 2% of the Brazil's 5 X 10⁶ km2 Legal Amazon region. Virtually all planned hydroelectric dams are in the forested portion of the region, of which they would represent approximately 2.5 to 2.9%.
TRAJECTORY OF CHANGE IN THE LANDSCAPE
Estimates of the old (pre-1970) secondary forests are critical to carbon stocks in the deforested landscape. The old secondary forest (capoeirão) in Pará and Maranhão totals almost 100,000 km2, or about one-fourth of the 1990 deforested landscape. As these stands are cut, the average carbon stock in the deforested landscape will decline. The rate of uptake by the landscape will also increase as younger, more vigorously growing, vegetation replaces the old secondary forests (Fearnside and Guimarães, 1995). The rate at which the old secondary forests are cut is estimated in Table 5.
(Table 5 here)
The calculated areas and percentages of the landscape in each land-use category are given in Table 6 for 1989, 1990 and 1991, and projected to 2090. Hydroelectric dams, which flooded 5 X 10³ km2 by 1991, could expand substantially (not included in the projection).
(Table 6 here)
The projected changes in the 13.8 X 10³ km2 cleared in 1990 are shown in Figure 3. The changes in the entire deforested landscape (422 X 103 km2 in 1991, exclusive of dams, growing at a rate of 11.1 X 10³ km2 year-1) are projected in Figure 4.
(Figures 3 and 4 here)
CARBON STOCKS IN REPLACEMENT VEGETATION
The carbon stock in each land use at equilibrium or at any given time depends not only on the area present but also on the average age of the vegetation and the growth rate that has prevailed. As the 1990 landscape and the projections of future changes indicate, pasture and secondary forest derived from pasture dominate the landscape. The growth rate of secondary forest derived from pasture is slower than that in secondary forest derived from agriculture (Fearnside and Guimarães, 1995).
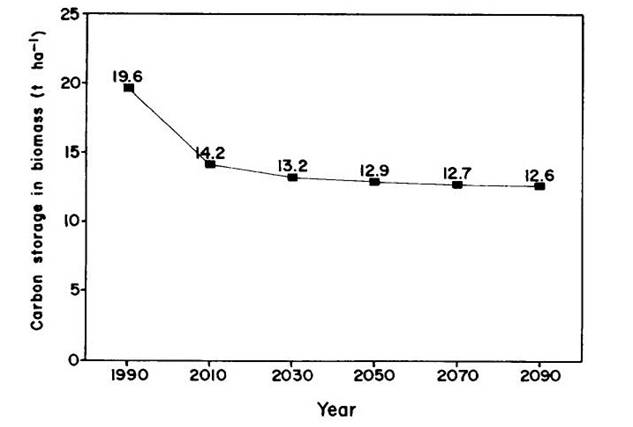
Using the growth rates of land in each age class in each of the land-use categories (Fearnside and Guimarães, 1995), one can calculate the biomass present at each year as the landscape approaches equilibrium. The changes over time in the carbon stock in land in each land-use category are shown in Figure 5. The changes for a given cohort of land, such as the 13.8 X 10³ km2 cleared in 1990, are shown in Figure 6. Carbon content of replacement vegetation is assumed to be 45% of dry matter, a value in good agreement with measurements in secondary forest (Guimarães, 1993). Carbon content in secondary forests is lower than the 50% content in primary forests (Fearnside et al., 1993). The changes in carbon stock in the entire deforested landscape are shown in Figure 7.
(Figures 5, 6 and 7 here)
The average total biomass (dry matter, including below-ground and dead components) of the landscape that had been deforested through 1990 is estimated to have been 43.5 t ha-1 in that year, or 19.6 t ha-1 of carbon. If land-use behavior patterns prevailing in the region at present remain unchanged until the landscape approaches equilibrium, average biomass will approach a value of 28.5 t ha-1 (12.8 t C ha-1). The decrease of about 35% in carbon stock from 1990 to the equilibrium condition is largely due to removal of high-biomass 'old' (pre-1970) secondary forests. The effect of removing old secondary forests is partially offset by expansion of secondary forests derived from cattle pasture. The carbon stock in the 1990 landscape is about four times the 5 t ha-1 assumed in global carbon calculations used by the IPCC, and the equilibrium stock is more than double the IPCC value. While a higher carbon stock in the replacement landscape tends to decrease the net emission of greenhouse gases from deforestation, the impact is still tremendous. The equilibrium replacement landscape has a biomass only 6% as high as the average biomass of the original forest in the region.
Grouping land uses into only six categories (regenerated forest, farmland, productive pasture, degraded pasture, secondary forest derived from agriculture, and secondary forest derived from pasture) represents a simplification of the successional path following clearing (see Fearnside, 1990a,b), but is valuable as a first approximation. Among the factors that could alter the successional course projected here is the possibility that changes in the region's rainfall regime as a result of deforestation could worsen the replacement vegetation scenario from the carbon storage point of view by favoring savannaization (Fearnside, 1985c, 1989c; Shukla et al., 1990).
CONCLUSIONS
The biomass and carbon stock in the landscape that replaces Brazil's Amazonian forest after deforestation can be expected to decrease by about 35% from their 1990 levels as the land uses in the region approach an equilibrium composition implied by the current behavior patterns of farmers and ranchers. The biomass of the equilibrium replacement landscape is four times higher than has been assumed in global carbon calculations, a finding which reduces the net emission of greenhouse gases from deforestation. However, the equilibrium replacement landscape has a biomass only 6% as high as original forest, implying that a heavy impact on global warming is caused by each hectare of deforestation.
ACKNOWLEDGMENTS
I thank the Pew Scholars Program in Conservation and the Environment and by the Fundação Banco do Brasil (Grant 10/1516-2) for financial support. S.V. Wilson and two annonymous reviewers made useful comments on the manuscript. This work has benefited from the stimulation of the F-7 group coordinated by the Lawrence Berkeley Laboratory with support from the Climate Change Division, U.S. Environmental Protection Agency.
REFERENCES
Brazil, Instituto Brasileiro de Geografia e Estatística (IBGE) and
Instituto Brasileiro do Desenvolvimento Florestal (IBDF). 1988. Mapa de
Vegetação do Brasil. Scale 1:5,000,000. Instituto Brasileiro do Meio Ambiente e
dos Recursos Naturais Renováveis (IBAMA), Brasília, DF.
Brazil, Ministério das Minas e Energia, Centrais Elétricas do Brasil (ELETROBRÁS), 1987. Plano 2010: Relatório Geral. Plano Nacional de Energia Elétrica 1987/2010. (Dezembro de 1987). ELETROBRÁS, Brasilia, DF, 269 pp.
Buschbacher, R.J., 1984. Changes in Productivity and Nutrient Cycling following Conversion of Amazon Rainforest to Pasture. Ph.D. Dissertation, University of Georgia, Athens, 193 pp.
Detwiler, R.P. and Hall, C.A.S., 1988. Tropical forests and the global carbon cycle. Science, 239: 42-47.
Dickinson, R.E. and Henderson-Sellers, A., 1988. Modelling tropical deforestation: A study of GCM land-surface parameterizations. Quarterly J. Royal Meteorol. Soc., 114: 439-462.
Fearnside, P.M., 1984. Land clearing behaviour in small farmer settlement schemes in the Brazilian Amazon and its relation to human carrying capacity. In: A.C. Chadwick and S.L. Sutton (Editors), Tropical Rain Forest: The Leeds Symposium. Leeds Philosophical and Literary Society, Leeds, UK, pp. 255‑271.
Fearnside, P.M., 1985a. Brazil's Amazon forest and the global carbon problem. Interciencia, 10(4): 179-186.
Fearnside, P.M., 1985b. Agriculture in Amazonia. In: G.T. Prance and T.E. Lovejoy (Editors), Key Environments: Amazonia. Pergamon Press, Oxford, UK, pp. 393‑418.
Fearnside, P.M., 1985c. Environmental change and deforestation in the Brazilian Amazon. In: J. Hemming (Editor), Change in the Amazon Basin: Man's Impact on Forests and Rivers. Manchester Univ. Press, Manchester, UK, pp. 70‑89.
Fearnside, P.M., 1986. Human Carrying Capacity of the Brazilian Rainforest, Columbia Univ. Press, New York, 293 pp.
Fearnside, P.M., 1987. Summary of
progress in quantifying the potential contribution of Amazonian deforestation
to the global carbon problem. In: D. Athié, T.E. Lovejoy and P. de M. Oyens
(Editors), Proceedings of the Workshop on Biogeochemistry of Tropical Rain
Forests: Problems for Research. Universidade
de São Paulo, Centro de Energia Nuclear na Agricultura (CENA), Piracicaba, São
Paulo, SP, pp. 75-82.
Fearnside, P.M., 1989a. Extent and causes of tropical forest destruction. Testimony to the German Bundestag Study Commission on 'Preventative Measures to Protect the Earth's Atmosphere' Bonn, 2-3 May 1989, 15 pp.
Fearnside, P.M., 1989b. A Ocupação Humana de Rondônia: Impactos, Limites
e Planejamento. Programa POLONOROESTE Relatório de Pesquisa No. 5. Conselho
Nacional de Desenvolvimento Científico e Tecnológico (CNPq), Brasilia, DF, 76
pp.
Fearnside, P.M., 1989c. An ecological analysis of predominant land uses in the Brazilian Amazon. The Environmentalist, 8(4): 281‑300.
Fearnside, P.M., 1990a. Fire in the tropical rain forest of the Amazon Basin. In: J.G. Goldammer (Editor), Fire in the Tropical Biota: Ecosystem Processes and Global Challenges. Springer-Verlag, Heidelberg, pp. 106-116.
Fearnside, P.M., 1990b. Deforestation in Brazilian Amazonia. In: G.M. Woodwell (Editor), The Earth in Transition: Patterns and Processes of Biotic Impoverishment. Cambridge Univ. Press, New York, pp. 211-238.
Fearnside, P.M., 1991. Greenhouse gas contributions from deforestation in Brazilian Amazonia. In: J.S. Levine (Editor), Global Biomass Burning: Atmospheric, Climatic, and Biospheric Implications. MIT Press, Boston, pp. 92-105.
Fearnside, P.M., 1992. Greenhouse Gas Emissions from Deforestation in the Brazilian Amazon. Carbon Emissions and Sequestration in Forests: Case Studies from Developing Countries. Volume 2. LBL-32758, UC-402. Climate Change Division, Environmental Protection Agency, Washington, DC and Energy and Environment Division, Lawrence Berkeley Laboratory (LBL), University of California (UC), Berkeley, 73 pp.
Fearnside, P.M., 1993. Deforestation in Brazilian Amazonia: The effect of population and land tenure. Ambio, 22(8): 537-545.
Fearnside, P.M., In prep. Biomass of Brazil's Amazonian forests.
Fearnside, P.M. and Ferraz, J. 1995. A conservation gap analysis of Brazil's Amazonian vegetation. Conserv. Biol. (in press).
Fearnside, P.M. and Guimarães, W.M., 1995. Carbon uptake by secondary forests in Brazilian Amazonia. For. Ecol. Manage. [forthcoming].
Fearnside, P.M., Leal Filho, N. and Fernandes, P.M., 1993. Rainforest burning and the global carbon budget: Biomass, combustion efficiency and charcoal formation in the Brazilian Amazon. J. Geophys. Res., 98(D9): 16,733-16,743.
Fearnside, P.M., Leal Filho, N., Graça, P.M.L.A., Ferreira, G.L., Custodio, R.A. and Rodrigues, F.J.A., In prep. Pasture biomass and productivity in Brazilian Amazonia.
Guimarães, W.M., 1993. Liberação de carbono e mudanças nos estoques
dos nutrientes contidos na biomassa aérea e no solo resultante de queimadas de
florestas secundárias em áreas de pastagens abandonadas, em Altamira, Pará.
Masters Thesis, Instituto Nacional de Pesquisas da Amazônia/Fundação
Universidade do Amazonas (INPA/FUA), Manaus, AM, 69 pp.
Hall, C.A.S., Detwiler, R.P., Bogdonoff, P. and Underhill, S., 1985. Land use change and carbon exchange in the tropics: I. Detailed estimates for Costa Rica, Panama, Peru, and Bolivia. Environmental Management, 9(4): 313-334.
Houghton, J.T., Meira Filho, L.G., Bruce, J., Lee, Housung, Callander, B.A., Haites, E., Harris, N and Maskell, K. (Editors.) 1995. Climate Change 1994: Radiative Forcing of Climate Change and an Evaluation of the IPCC IS9 Emission Scenarios. Cambridge University Press, Cambridge. 339 pp.
Houghton, R.A., Boone, R.D., Fruchi, J.R., Hobbie, J.E., Melillo, J.M., Palm, C.A., Peterson, B.J., Shaver, G.R., Woodwell, G.M., Moore, B., Skole, D.L. and Myers, N., 1987. The flux of carbon from terrestrial ecosystems to the atmosphere in 1980 due to changes in land use: Geographic distribution of the global flux. Tellus, 39B: 122-139.
Houghton, R.A., Boone, R.D., Melillo, J.M., Palm, C.A., Woodwell, G.M., Myers, N., Moore, B. and Skole, D. L., 1985. Net flux of carbon dioxide from tropical forests in 1980. Nature, 316: 617‑620.
Houghton, R.A., Woodwell, G.M., Sedjo, R.A., Detwiler, R.P., Hall C.A.S. and Brown, S., 1988. The global carbon cycle. Science, 241: 1736-1739.
Houghton, R.A., 1991. Tropical deforestation and atmospheric carbon dioxide. Climatic Change, 19(1-2): 99-118.
Jeffers, J.N.R., 1978. An Introduction to Systems Analysis: with Ecological Applications. Arnold, London, 198 pp.
Moran, E.F., 1993. Deforestation and land use in the Brazilian Amazon. Human Ecology, 21(1): 1-21.
Moran, E.F., Brondizio, E, Mausel, P. and Wo, Y., 1994. Integrating Amazonian vegetation, land-use, and satellite data. BioScience, 44(5): 329-338.
Myers, N., 1989. Deforestation Rates in Tropical Forests and their Climatic Implications. Friends of the Earth, London, 116 pp.
Saldarriaga, J.G., West, D.C. and Tharp, M.L., 1986. Forest Succession in the Upper Rio Negro of Colombia and Venezuela. Oak Ridge National Laboratory (ORNL), Environmental Sciences Division Publication No. 2694 (NTIS Pub. ORNL/TM-9712), National Technical Information Service (NTIS), U.S. Dept. of Commerce, Springfield, VA, 164 pp.
Shukla, J., Nobre, C. and Sellers, P., 1990. Amazon deforestation and climate change. Science, 247: 1322-1325.
Skole, D.L., Chomentowski, W.H., Salas, W.A. and Nobre, A.D., 1994. Physical and human dimensions of deforestation in Amazonia. BioScience, 44(5): 314-322.
Uhl, C., Buschbacher, R. and Serrão, E.A.S., 1988. Abandoned pastures in Eastern Amazonia. I. Patterns of plant succession. J. Ecol., 76: 663-681.
Uhl, C., Clark, H., Clark, K. and Maquirino, P., 1982. Successional patterns associated with slash-and-burn agriculture in the Upper Rio Negro region of the Amazon Basin. Biotropica, 14: 249-254.
UNESCO/UNEP/FAO (United Nations Educational Scientific and Cultural Programme/United Nations Environment Programme/Food and Agricultural Organization of the United Nations), 1978. Tropical Forest Ecosystems: A State of Knowledge Report. UNESCO, Paris, 683 pp.
Vermeer, D.E., 1970. Population pressure and crop rotational changes among the Tiv of Nigeria. Annals of the Association of American Geographers, 60: 299-314.
Watson, R.T., Meira Filho, L.G., Sanhueza, E. and Janetos, A., 1992. Greenhouse gases: Sources and sinks. In: J.T. Houghton, B.A. Callander, and S.K. Varney (Editors), Climate Change 1992: The Supplementary Report to the IPCC Scientific Assessment. Cambridge Univ. Press, Cambridge, UK, pp. 25-46.
Watson, R.T., Rodhe, H., Oeschger, H. and Siegenthaler, U., 1990. Greenhouse gases and aerosols. In: J.T. Houghton, G.J. Jenkins and J.J. Ephraums (Editors), Climate Change: The IPCC Scientific Assessment. Cambridge Univ. Press, Cambridge, UK, pp. 1-40.
Figure legends
Figure 1: Brazil's Legal Amazon Region.
Figure 2:Annual probabilities of transition for equilibrium calculation.
Figure 3:Projected percentage of land uses in area deforested in 1990 (cohort of 13.8 X 10³ km2).
Figure 4:Projected percentages of land uses in deforested area (all deforested land, independent of when first cleared).
Figure 5:Carbon stock in different land uses (above- and below-ground).
Figure 6:Projected carbon storage for land deforested in 1990. Changes result from land-use transformations among categories in the 13.8 X 10³ km2 area cleared in 1990.
Figure 7:Effect of changes in the landscape on carbon storage. Changes are in all areas cleared from original forest, irrespective of the year of clearing. Results exclude hydroelectric dams.
TABLE 1: LAND USE AMONG SMALL FARMERS: TRANSITION PROBABILITIES AT DIFFERENT SITES
Initial Final Site Notes
state state ‑‑‑‑‑‑‑‑‑‑‑‑‑‑‑‑‑‑‑‑‑‑‑‑‑‑‑‑‑‑‑‑‑‑‑‑‑‑‑‑--
Rondonia Rondonia Eastern Eastern Mean
1986‑88 1988‑89 Altamira Altamira (Rondonia
(a) (a) km 23 km 46 & eastern
1985‑91 1985‑91 Altamira)
(b) (b)
‑‑‑‑‑‑‑‑‑‑‑‑‑‑‑‑‑‑‑‑‑‑‑‑‑‑‑‑‑‑‑‑‑‑‑‑‑‑‑‑‑‑‑‑‑‑‑‑‑‑‑‑‑‑‑‑‑‑‑‑‑----
Farmland Productive 0.565 0.455 0.510 (c)
pasture
Productive Secondary 0.11 0.22 0.371 0.242 0.236 (d)
pasture forest
Farmland Secondary 0.11 0.22 0.287 0.000 0.154
forest
Secondary Farmland 0.237 0.136 0.061 0.168 (e)
forest
from farmland
Secondary Productive 0 0.013 0.088 0.025 (e)
forest pasture
from farmland
Secondary Farmland 0.237 0.136 0.061 0.168 (e)
forest
from pasture
Secondary Productive 0 0.013 0.088 0.025 (e)
forest pasture
from pasture
‑‑‑‑‑‑‑‑‑‑‑‑‑‑‑‑‑‑‑‑‑‑‑‑‑‑‑‑‑‑‑‑‑‑‑‑‑‑‑‑‑‑‑‑‑‑‑‑‑‑‑‑‑‑‑‑‑‑‑‑‑‑‑‑‑
(a) Skole et al., 1994.
(b) Calculated from data in Moran et al., 1994.
(c) Farmland is 'crops;' all 'bare' land is considered to be pasture as Moran et al. (1994) state that much bare land was actually very dry pasture.
(d) Secondary succession includes degraded pasture.
(e) Rondonia 1988‑89 probability is calculated assuming all secondary forests that are cut are converted to farmland.
TABLE 2: CALCULATION OF TRANSITION PROBABILITIES FOR RANCHERS
Transition Average Source Fraction Source
‑‑‑‑‑‑‑‑‑‑‑‑‑‑‑‑‑‑‑‑‑‑‑‑ age at of transi‑
Initial Subsequent time of tions
state state transition entering
(years) this
land‑use
category
‑‑‑‑‑‑‑‑‑‑‑‑‑‑‑‑‑‑‑‑‑‑‑‑‑‑‑‑‑‑‑‑‑‑‑‑‑‑‑‑‑‑‑‑‑‑‑‑‑‑‑‑-------------
Regenerated Farmland 0 (a) 0.1 (a)
forest
Regenerated Productive 0 (a) 0.9 (a)
forest pasture
Farmland Productive 2.0 (c) 0.9 (d)
pasture
Farmland Secondary forest 2.0 (c) 0.1 (d)
from farmland
Productive Degraded 8.8 (f) 0.1 (d)
pasture pasture
Productive Secondary forest 8.8 (g) 0.9 (d)
pasture from pasture
Degraded Productive 13 (h) 0.1 (d)
pasture pasture
Degraded Secondary forest 13 (k) 0.9 (d)
pasture from pasture
Secondary Farmland 5.2 (g) 0.1 (d)
forest from
farmland
Secondary Productive 5.2 (g) 0.9 (d)
forest from pasture
farmland
Secondary Regenerated 100 (m) ‑-
forest from forest
farmland
Secondary Farmland 6.7 (o) 0.1 (d)
forest from
pasture
Secondary Productive 6.7 (o) 0.9 (d)
forest from pasture
pasture
Secondary Regenerated 100 (m) ‑‑
forest from forest
pasture
‑‑‑‑‑‑‑‑‑‑‑‑‑‑‑‑‑‑‑‑‑‑‑‑‑‑‑‑‑‑‑‑‑‑‑‑‑‑‑‑‑‑‑‑‑‑‑‑‑‑---------------
(a) This analysis only treats the fate of the already deforested landscape, not the process of initial deforestation. Regenerated forest can be thought of as immediately reallocated to farmland and productive pasture, along with other newly deforested land.
(b) Calculated as the product of the annual probability of transfer out of the initial state times the fraction of transfers entering this land-use category.
(c) General observation (see text).
(d) Educated guess.
(e) Calculated as P = 1/t, where P = annual probability of transition out of the initial state; t = average age at time of transition.
(f) Assumed same as productive pasture to secondary forest from pasture transition probability.
(g) Guimarães, 1993, p. 17.
(h) Calculated for t = 50 years with area of resource limited by transfer to other land use. Average age is 7 years at t = 15 years. If unlimited by time or resources, average age = 1/0.007 = 143 years.
(i) Sum of the probabilities of transfers to other land uses.
(j) Calculated as P = 1‑(1‑C)1/d where P = the annual probability of transfer, C = the fraction of the original land use that has undergone the transfer, d = the average time elapsed over which the land use has been subject to the transfer (years); C = 0.1, d = 15 years (Uhl et al., 1988).
(k) Calculated for t = 50 years with area of resource limited by transfer to other land use. Average age is 7 years at t = 15 years. If time and resource are infinite, average age = (1‑0.9)/0.007 = 14 years.
(l) P = 1/e where P = annual probability of transition from initial to subsequent state; e = average time elapsed over which the land has been subject to the transition (e = 15 years: Uhl et al., 1988).
(m) By definition (see text).
(n) Calculated as (1‑B)t, where B = the annual probability of transfer out of the initial state and t = the average age at time of transfer.
(o) t = 1/P where t = average age at transition; P = annual probability of transition out of the initial state.
(p) Calculated from eastern Altamira data sets of Moran et al., 1994 (see Table 1).
Annual Source Annual Source
probability probability
of transition of transition
out of the from initial
initial state to subsequent
state
‑‑‑‑‑‑‑‑‑‑‑‑‑‑‑‑‑‑‑‑‑‑‑‑‑‑‑‑‑‑‑‑‑-----------------
1.000
(a) 0.100 (b)
1.000
(a) 0.900 (b)
0.500 (e) 0.450 (b)
0.500 (e) 0.050 (b)
0.113 (e) 0.011 (b)
0.113 (e) 0.102 (b)
0.074 (i) 0.007 (j)
0.074 (i) 0.067 (l)
0.192 (e) 0.019 (b)
0.192 (e) 0.173 (b)
0.192 (i) 0.000000001 (n)
0.149 (p) 0.015 (b)
0.149 (p) 0.134 (b)
0.149 (i) 0.0000001 (n)
‑‑‑‑‑‑‑‑‑‑‑‑‑‑‑‑‑‑‑‑‑‑‑‑‑‑‑‑‑‑‑‑‑-----------------
TABLE 3: MARKOV MATRICES FOR SMALL FARMERS, RANCHERS AND THE REGIONAL CALCULATION
Regenerated Farmland Productive Degraded
forest pasture pasture
A.) SMALL FARMERS
‑‑‑‑‑‑‑‑‑‑‑‑‑‑‑‑‑‑‑‑‑‑‑‑‑‑‑‑‑‑‑‑‑‑‑‑‑‑‑‑‑‑‑‑‑‑‑‑‑‑‑‑‑‑‑‑‑‑‑‑‑‑‑‑‑
Regenerated forest 0 0.910 0.090 0
Farmland 0 0.336 0.510 0
Productive pasture 0 0 0.764 0
Degraded pasture 0 0 0.007 0.926
Secondary forest 0.0000000005 0.168 0.025 0
from farmland
Secondary forest 0.00000001 0.168 0.025 0
from pasture
‑‑‑‑‑‑‑‑‑‑‑‑‑‑‑‑‑‑‑‑‑‑‑‑‑‑‑‑‑‑‑‑‑‑‑‑‑‑‑‑‑‑‑‑‑‑‑‑‑‑‑‑‑‑‑‑‑‑‑‑‑‑‑‑‑
B.) RANCHERS
‑‑‑‑‑‑‑‑‑‑‑‑‑‑‑‑‑‑‑‑‑‑‑‑‑‑‑‑‑‑‑‑‑‑‑‑‑‑‑‑‑‑‑‑‑‑‑‑‑‑‑‑‑‑‑‑‑‑‑‑‑‑‑‑‑
Regenerated forest 0 0.100 0.900 0
Farmland 0 0.500 0.450 0
Productive pasture 0 0 0.887 0.011
Degraded pasture 0 0 0.007 0.926
Secondary forest 0.000000001 0.019 0.173 0
from farmland
Secondary forest 0.0000001 0.015 0.134 0
from pasture
‑‑‑‑‑‑‑‑‑‑‑‑‑‑‑‑‑‑‑‑‑‑‑‑‑‑‑‑‑‑‑‑‑‑‑‑‑‑‑‑‑‑‑‑‑‑‑‑‑‑‑‑‑‑‑‑‑‑‑‑‑‑‑‑‑
C.) REGIONAL CALCULATION (Weighted average small farmers and ranchers)
‑‑‑‑‑‑‑‑‑‑‑‑‑‑‑‑‑‑‑‑‑‑‑‑‑‑‑‑‑‑‑‑‑‑‑‑‑‑‑‑‑‑‑‑‑‑‑‑‑‑‑‑‑‑‑‑‑‑‑‑‑‑‑--
Regenerated forest 0 0.347 0.653 0
Farmland 0 0.450 0.468 0
Productive pasture 0 0 0.849 0.008
Degraded pasture 0 0 0.007 0.926
Secondary forest 0.000000001 0.065 0.128 0
from farmland
Secondary forest 0.0000001 0.061 0.101 0
from pasture
‑‑‑‑‑‑‑‑‑‑‑‑‑‑‑‑‑‑‑‑‑‑‑‑‑‑‑‑‑‑‑‑‑‑‑‑‑‑‑‑‑‑‑‑‑‑‑‑‑‑‑‑‑‑‑‑‑‑‑‑‑‑‑‑‑
Secondary Secondary Residence
forest forest time
from from (years)
farmland pasture
-------------------------------
0 0 1.0
0.154 0 1.5
0 0.236 4.2
0 0.067 13.6
0.807 0 5.2
0 0.807 5.2
------------------------------
------------------------------
0 0 1.0
0.050 0 2.0
0 0.102 8.8
0 0.067 13.6
0.808 0 5.2
0 0.851 6.7
------------------------------
------------------------------
0 0 1.0
0.082 0 1.8
0 0.143 6.6
0 0.067 13.6
0.807 0 5.2
0 0.838 6.2
------------------------------
TABLE 4: REPLACEMENT VEGETATION WEIGHTED BIOMASS CALCULATION AT EQUILIBRIUM
Category Equilibrium Biomass Residence Biomass
proportion (t ha-1 time source
total) (years)
‑‑‑‑‑‑‑‑‑‑‑‑‑‑‑‑‑‑‑‑‑‑‑‑‑‑‑‑‑‑‑‑‑‑‑‑‑‑‑‑‑‑‑‑‑‑‑‑‑‑‑‑‑‑‑‑‑‑‑‑‑----
Forest 0.000 463.6 0.0 (a)
Farmland 0.040 0.7 0.9 (b)
Productive pasture 0.438 10.7 4.2 (c)
Degraded pasture 0.052 8.0 9.1 (d)
Secondary forest 0.020 35.6 3.2 (d)
from agriculture
Secondary forest 0.449 50.5 3.9 (d)
from pasture
Weighted mean: 28.5
‑‑‑‑‑‑‑‑‑‑‑‑‑‑‑‑‑‑‑‑‑‑‑‑‑‑‑‑‑‑‑‑‑‑‑‑‑‑‑‑‑‑‑‑‑‑‑‑‑‑‑‑‑‑‑‑‑‑‑‑‑‑‑‑‑
(a) Secondary forest is assumed to be equivalent to original forest from the standpoint of biomass after 100 years. Saldarriaga et al. (1986, p. 96) calculated recovery in 144‑189 years in Venezuela. Original forest biomass from Fearnside (in prep.).
(b) Guess: above‑ground biomass=0.5 t ha-1; root/shoot ratio=0.3.
(c) Fearnside et al., in prep-b; see Fearnside, 1989b.
(d) Calculated from the residence time and growth rate (Fearnside and Guimarães, 1995).
TABLE 5: PRE‑1970 SECONDARY FOREST
Area of Percent
pre‑1970 of
State Area of pre‑1970 secondary pre‑1970
secondary forest (km2) forest secondary
‑‑‑‑‑‑‑‑‑‑‑‑‑‑‑‑‑‑‑‑‑‑‑‑‑‑‑-- cleared forest
Present Cleared Present per area
in by in year cleared
1988 (a) 1988 (b) 1970 (c) (km2) per year
‑‑‑‑‑‑‑‑‑‑‑‑‑‑‑‑‑‑‑‑‑‑‑‑‑‑‑‑‑‑‑‑‑‑‑‑‑‑‑‑‑‑‑‑‑‑‑‑‑‑‑‑‑‑‑‑‑‑‑‑‑‑‑‑
Pará 39,819 10,369 50,188 576 1.15
Maranhão 57,824 2,459 60,283 137 0.23
Total 97,643 12,828 110,471 713 0.65
‑‑‑‑‑‑‑‑‑‑‑‑‑‑‑‑‑‑‑‑‑‑‑‑‑‑‑‑‑‑‑‑‑‑‑‑‑‑‑‑‑‑‑‑‑‑‑‑‑‑‑‑‑‑‑‑‑‑‑‑‑‑‑‑
(a) Fearnside et al., in prep‑a.
(b) Fearnside, 1990a, p. 219.
(c) The year before which secondary forests are considered "old deforestation" is reported variously by the INPE team working with the images as 1960 and 1970. In truth, both are guesses. Here 1970 is assumed to be the date, as the clearing prior to this would have been much slower than that after this date.
TABLE 6: CALCULATED LANDSCAPE IN BRAZILIAN AMAZONIA
Land use Area (103 km2) Percent of deforested area
‑‑‑‑‑‑‑‑‑‑‑‑‑‑‑‑‑- ‑‑‑‑‑‑‑‑‑---------------
1989 1990 1991 1989 1990 1991
‑‑‑‑‑‑‑‑‑‑‑‑‑‑‑‑‑‑‑‑‑‑‑‑‑‑‑‑‑‑‑‑‑‑‑‑‑‑‑- ‑‑‑‑‑‑‑‑‑---------------
Regenerated forest 0 0 0 0.0 0.0 0.0
Farmland 23 22 21 5.8 5.4 5.1
Productive pasture 179 184 187 45.1 44.8 44.4
Degraded pasture 8 8 8 2.1 2.2 2.3
Secondary forest 8 8 8 2.1 2.1 2.1
from farmland
Secondary forest 107 115 123 26.9 28.1 29.3
from pasture
Pre‑1970 secondary 72 71 71 18.1 17.4 16.8
forest
Terrestrial total 397 410 422 100.0 100.0 100.0
‑‑‑‑‑‑‑‑‑‑‑‑‑‑‑‑‑‑‑‑‑‑‑‑‑‑‑‑‑‑‑‑‑‑‑‑‑‑‑‑ ‑‑‑‑‑‑‑‑‑--------------
Hydroelectric dams 4.8 4.8 4.8
‑‑‑‑‑‑‑‑‑‑‑‑‑‑‑‑‑‑‑‑‑‑‑‑‑‑‑‑‑‑‑‑‑‑‑‑‑‑‑-
Total all uses 401 415 426
‑‑‑‑‑‑‑‑‑‑‑‑‑‑‑‑‑‑‑‑‑‑‑‑‑‑‑‑‑‑‑‑‑‑‑‑‑‑‑‑
‑‑‑‑‑‑‑‑‑‑‑‑‑
2050 2090
‑‑‑‑‑‑‑‑‑‑‑‑‑
0.0 0.0
5.4 5.2
47.2 46.8
4.0 4.4
2.2 2.2
39.2 40.5
2.0 0.9
100.0 100.0
‑‑‑‑‑‑‑‑‑‑‑‑‑‑
Fig. 1
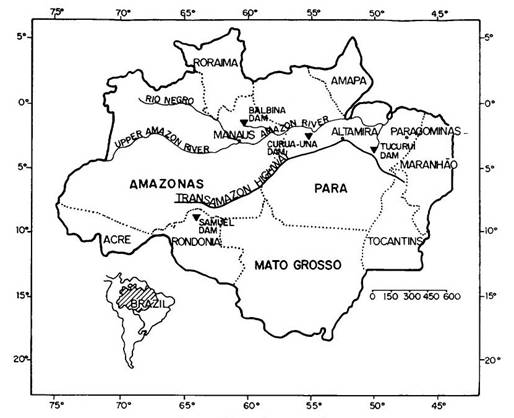
Fig. 2
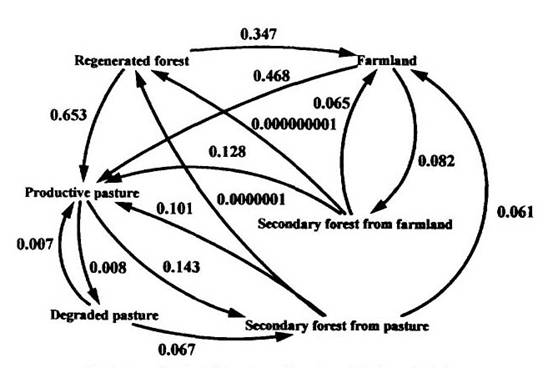
Fig. 3
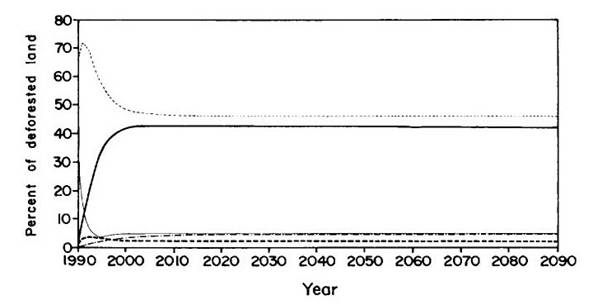
Fig. 4
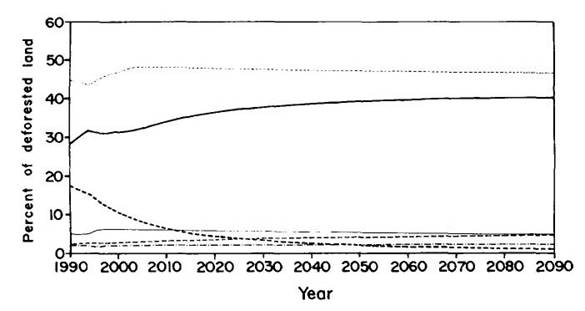
Fig. 5
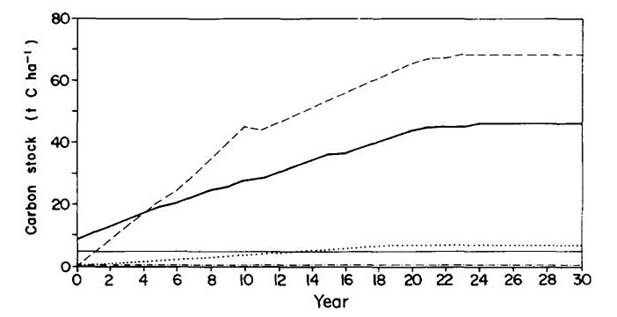
Fig. 6
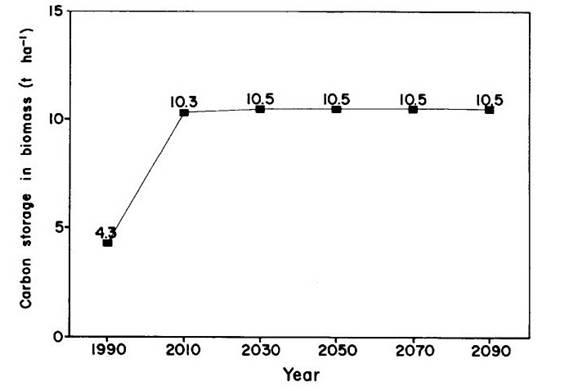
Fig. 7