Fig. 1
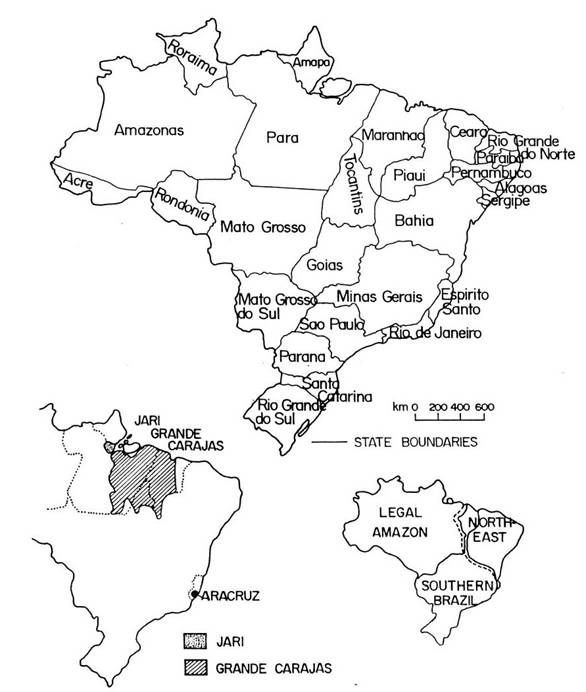
Fig. 2
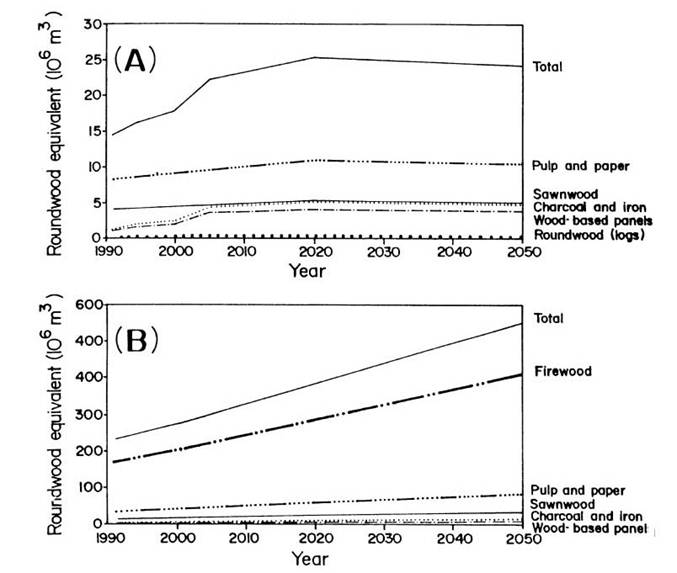
Fig. 3
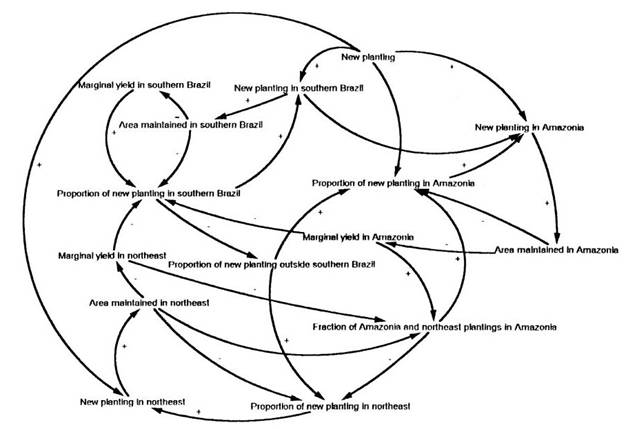
Fig. 4
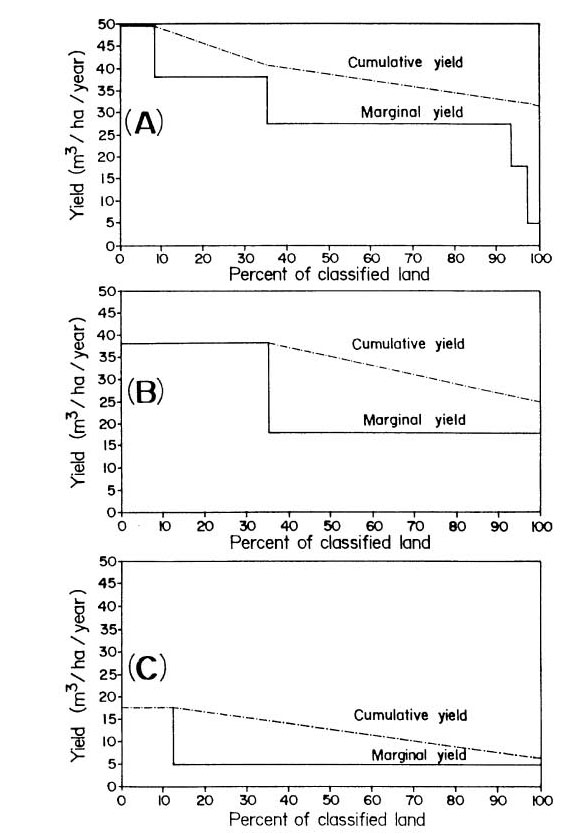
Fig. 5
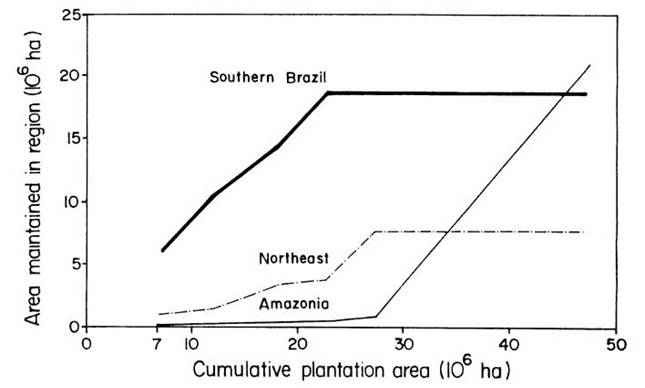
Fig. 6
The text that follows is a PREPRINT.
Please cite
as:
Fearnside, P.M.
1998.
ISSN: 0961-9534
Copyright:
Elsevier
The original
publication is available at http://elsevier.com.nl
PLANTATION FORESTRY IN BRAZIL:
PROJECTIONS TO 2050
Philip M. Fearnside
National Institute for Research
in the Amazon (INPA)
C.P. 478
69011-970 Manaus, Amazonas
BRAZIL
Fax:
55-92-236-3822
Tel:
55-92-236-2652
55-92-643-1822
Email PMFEARN@INPA.GOV.BR
1 Feb. 1995
10 Nov. 1995
15 Nov. 1995
18 Sept. 1997
23 Sept. 1997
29 Sept. 1997
23 June 1998
TABLE OF CONTENTS
List of Tables ......................................
List of Figures .....................................
ABSTRACT .............................................
1. INTRODUCTION ......................................
2. BRAZIL'S PLANTATION SILVICULTURE SECTOR
2.1. Present trends in plantation silviculture ......
2.2. Use levels of forest products
2.2.1. Current use levels .......................
2.2.2. Projected use levels .....................
3. MODEL FOR PROJECTION OF SILVICULTURAL EXPANSION
3.1. Model and assumptions ...........................
3.2. Simulation results ..............................
3.3. Implications for climate change impacts and responses ..
4. CONCLUSIONS .......................................
Acknowledgments ......................................
REFERENCES ............................................
Figure Legends
Tables
Figures
LIST OF TABLES
Table 1. Classification of wood products by use and consumer in Brazil (1991).
Table 2. Sources of wood supply in Brazil (1991).
Table 3. Brazilian domestic sources of wood supply (1991).
Table 4. Brazilian pulp and paper sector in 1991.
Table 5. Use of firewood and charcoal (fuel) in Brazil.
LIST OF FIGURES
Fig. 1. Regions of Brazil and locations mentioned in the text. "Southern Brazil" refers to the portion that is neither Amazonian nor Northeastern.
Fig. 2. A.) Export of wood products from Brazil and B.) domestic consumption of wood products.
Fig. 3. Causal loop diagram of model for shifts of plantation establishment activity among regions of Brazil.
Fig. 4. Marginal yield of plantations with expansion of plantation area in Brazil (based on FLORAM data): A) Southern Brazil, B) the Northeast, C) Amazonia.
Fig. 5. Simulated areas of plantations maintained in each region, showing the shift of planting activity from Southern Brazil to the Northeast and to Amazonia.
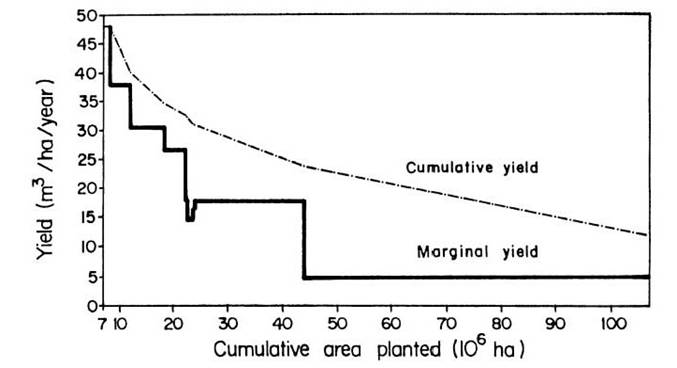
Fig. 6. Simulated results of the relation of marginal yield to plantation area expansion.
ABSTRACT--Brazil is fortunate in having large areas of land that are not currently forested but that are suitable for silvicultural plantations. Changes in the area and regional distribution of the country's silvicultural plantations imply a wide variety of environmental and social impacts. Projections of future development of plantation silviculture are needed for analyzing these impacts, as well as to serve as a reference scenario for evaluating the potential effects of climatic change on Brazil's plantations, and for the related task of evaluating the implications of proposals to combat global warming by increasing the area of silvicultural plantations in Brazil beyond the extent to which they would otherwise expand. Such a reference scenario provides the control, or "business as usual" standard, against which one can compare the situation as affected by climatic change and/or by additional silvicultural or other activities carried out to help mitigate climatic change. Assuming constancy of climate, technology, per-capita consumption of wood products, and Brazil's share of international trade, the area of plantations in 2050 would be 3.2 times larger than the area in 1991.
KEYWORDS--plantations; silviculture; eucalyptus; Brazil; global warming; climate mitigation; carbon offsets; climate change; pulp; carbon storage.
1. INTRODUCTION
Brazil is already a major global player in plantation forestry, with 7 X 10⁶ ha planted by 1991.1 These plantations represent 16% of the 44 X 106 ha total reported by FAO (1994) in the tropical zone, and Brazil is surpassed only by India (19 X 106 ha) and Indonesia (9 X 10⁶ ha). Further expansion is planned in Brazil. In the state of São Paulo, for example, the state government plans to encourage increases in the area of plantations from 750,000 ha in 1990 to 1.5-2.8 X 10⁶ ha in 2015.2
Expansion of plantation silviculture implies a wide variety of social and environmental costs and benefits, many of which depend on the areal extent and regional distribution of the plantations. A reference scenario representing the likely future development of Brazil's plantation silviculture sector is needed as a starting point for evaluating these effects. The reference scenario is needed as a basis against which to assess the potential effects of climatic change on Brazil's plantations, and for the related task of evaluating the implications of proposals to combat global warming by increasing the area of silvicultural plantations in Brazil beyond the extent to which they would otherwise expand. Such a reference scenario provides the control, or "business as usual" standard, against which one can compare the situation as affected by climatic change and/or by additional silvicultural or other activities carried out to help mitigate climatic change. The present paper summarizes information on the present trends in Brazil's plantation silviculture sector, the sources and uses of wood in Brazil, and develops a model for projecting the areal extent and yields of plantation silviculture and the distribution of plantations among the regions of the country. The model is then used to project changes in these features to the year 2050, given assumptions regarding population growth, wood product consumption per capita, and international trade.
2. BRAZIL'S PLANTATION SILVICULTURE SECTOR
2.1. Present trends in plantation silviculture
Brazil's silvicultural plantations are heavily concentrated in "Southern Brazil," which for this paper includes the portions of the country outside of Amazonia and the semiarid Northeast (Fig. 1). In Southern Brazil, which is also the location of most of the country's agriculture, land for additional plantations is becoming increasingly scarce, and movement of new planting initiatives to the Northeast and Amazonia has already begun.
[Figure 1 here]
Large firms have traditionally tried to plant sufficient areas to supply 70% of their needs for wood, with only 30% being accepted from third parties in the surrounding countryside. Such policies result in little economic benefit accruing to the area when a firm's holdings expand to dominate the landscape, as in the case of some parts of the states of São Paulo, Minas Gerais and Espirito Santo. Like many other kinds of companies in Brazil, silvicultural firms have recently been engaged in terceirização of their operations, or contracting out activities they formerly did themselves.
In the early 1990s, pulp firms greatly reduced their planting rates in the face of a price slump in international pulp markets.3 The firms apparently expect land owners in the viscinity of the mills to increase their planting of pulpwood. Prices oscillated during the 1990s, rising in late 1996 only to fall again in 1997. Shortfalls are likely to occur before prices rise sufficienly to induce individual landowners to plant more trees.
There are conflicting tendencies in the balance of short-rotation (approx. 6 years) and long-rotation (approx. 12 years) plantations in Brazil. The area planted in conifers (usually managed on long rotations) has been sharply decreasing, which may lead to a supply shortage by the end of the century.4 At the same time, the seeds of eucalyptus species appropriate for long-rotation plantations have been requested of the Institute for Forestry Research and Studies (IPEF) at Piracicaba, São Paulo, in ever-greater quantities relative to short-rotation species, a trend that has been continuing since 1980.4,5
Technological change has affected plantation forestry by increasing yields from plantations through genetic improvements and more refined management. At the Jari plantation on the border of Pará and Amapá, progress has been made in improving the quality of the trees grown and in matching varieties to soil conditions.6 At the Aracruz plantation in a former Atlantic Forest area of Espírito Santo, spectacular yields of over 80 m3 ha-1 yr-1 have been obtained in small demonstration plots on the best sites.7 Such high yields, however, are by no means typical of silviculture in Brazil, or even of the estates where these impressive achievements have been made. The Aracruz estate probably has a mean yield around 35 m3 ha-1 yr-1--the average yield over three cycles, rather than on the first cycle yields that give the spectacular results.4 Small well-tended demonstration plots also inevitably produce higher yields than commercial-scale plantations. Yields on the order of 30 m3 ha-1 yr-1 (averaged over three cycles) represent a practical limit on the average for soils of the quality of those in the 7 X 10⁶ ha already under plantations.4 The focus is on reducing the cost of extraction and transport, rather than increasing the yield per hectare. Any genetic work is likely to be for developing hybrids for marginal lands, rather than for achieving further yield increases on the best sites.4
2.2. Use levels of forest products
2.2.1. Current use levels. Wood products in Brazil in 1991 are classified by use and consumer in Table 1, and converted into roundwood equivalents. Calculation of roundwood equivalents is necessary in order to know the wood volumes that must be supplied to provide these products. The wood products are further divided into those for locally consumed end-products and those for export--to allow separate projections of changes in these two classes (Table 1). Brazil is highly self-sufficient in wood products, supplying from domestic sources 98.4% of its sawlog-equivalent wood and 99.3% of its fuel and pulpwood, in terms of roundwood equivalents. Exports represent 5.5% of the sawnwood produced and 5.9% of the fuel and pulpwood, in terms of roundwood equivalents. Fuel and pulpwood represent 82.7% of the total wood production. Firewood dominates these statistics with 69.8% of all wood products, in terms of roundwood equivalents.
[Table 1 here]
Sources of wood supply in Brazil are shown in Table 2, with wood in the two major categories (sawlogs versus pulp and firewood or equivalent) divided by source, including imports. Short-rotation plantations are assumed to occupy 95% of the total plantation area. Domestic sources of sawlog equivalent wood and fuel and pulpwood equivalent wood are apportioned to logging of native forests versus silvicultural plantations in Table 3. Plantations supply 16% of the sawlogs and 76% of the fuel and pulpwood.
[Tables 2 and 3 here]
The Brazilian pulp and paper sector in 1991 is summarized in Table 4, with production, imports, exports, reprocessing, and consumption converted to the appropriate roundwood equivalents. Table 4 distinguishes between "reprocessing" and "consumption" so that local benefits as product consumption are not inflated by the volumes being reprocessed for export. Brazil's total consumption of 16 X 106 m3 in roundwood equivalent in the final form (paper and paperboard) is twice the amount exported.
Use of firewood and charcoal, given by economic sector in Table 5 for 1972 and 1987, shows declining residential use of firewood by Brazil's increasingly urban population and the great increase in industrial use of charcoal (mainly for iron and steel production). Considering all sectors, charcoal use increased by almost 200% between 1972 and 1987, while firewood use declined by 35%. In per capita terms, the increase in charcoal use was 105%, while the decline in firewood use was 55% over this period. The role of wood-based energy changed over this period, with the percentage supplied by charcoal increasing from 2.7% to 4.0% and that from firewood declining from 35.5% to 11.5%. Whether plantation biomass is used for energy or pulp is largely a function of pulp prices.
[Table 5 here]
2.2.2. Projected use levels. Quantities of exported wood from long-rotation plantations (producing sawlog-equivalent wood) are assumed to change in proportion to changes in the population of non-tropical countries. These countries are assumed to represent the potential market for Brazilian wood exports, as tropical countries are unlikely to be able to afford to import these products in significant quantities. These export projections begin in 1992, starting from the 1991 values given in the FAO (1993) report.8 Export of products derived from short-rotation plantations (pulp, paper and paperboard, charcoal and charcoal-derived pig iron) are assumed to follow the same non-tropical country population trends. Export of wood products from Brazil, expressed as roundwood equivalents, is projected in Fig. 2A. Domestic consumption of wood products is shown in Fig. 2B.
[Figure 2 here]
Domestic consumption of all wood products is assumed to increase in proportion to the national population, assuming that Brazil's annual population growth rate to continue to decline at the same rate observed over the last two census periods (annual rate of population growth dropping by 0.2 percentage points each decade). Under this assumption, the population would reach 363 million by the year 2050. Brazil's population would reach 554 million by 2050 if the 1980-1992 rate continued unchanged (an unlikely occurrence).
Changes in population and consumption between 1980 and 1991 indicate that demand for firewood and for sawnwood were both best predicted by total population growth, although one might think that firewood demand would be more closely related to rural population, and that demand for sawnwood might be more closely related to urban population. Most firewood is used by bakeries, brick kilns and other businesses. Residential consumption declined by 50% over the 1972-1987 period, or 67% on a per-capita basis (Table 5).
Per-capita paper and paperboard demand in many countries has been shown to rise with increasing gross domestic product (GDP), while GDP elasticity declines with per-capita income18 (p. 191). The demand should therefore be expected to rise faster than the direct proportionality to population growth assumed here.
3. MODEL FOR PROJECTION OF SILVICULTURAL EXPANSION
3.1. Model and assumptions
As plantation areas expand, their areal extent and their distribution among the regions of Brazil are factors that have important implications for the social and environmental consequences of this land-use change, including both impacts and carbon benefits. A systems dynamics model, written in Vensim, has been developed by the author to represent the expansion, inter-regional distribution and yields of the country's plantation areas. The model is represented diagrammatically in Figure 3. In causal loop diagram such as this, the sign by each arrow indicates the direction of change in the quantity at the head of the arrow given an increase in the quantity at the tail of the arrow. The remainder of this section describes the structural parameters assumed in the model.
[Figure 3 here]
Plantation areas are assumed to expand to meet the level of production (domestic consumption + exports - imports) needed in the year the plantation will be harvested. Yields are assumed to begin at 20 m3 ha-1 yr-1 for "long-rotation" plantations grown on a 12-year cycle, and 30.2 m3 ha-1 yr-1 for "short-rotation" plantations grown on a 6-year cycle. The short-rotation yield is the mean of average yields at seven major plantation companies listed by Carpentieri et al. (1993).14
As the area under plantations increases, the average yield declines because of expansion into more marginal, less productive lands. For Southern Brazil, the decline can be inferred from the areas identified for industrial plantations by the FLORAM project (Florestas, Ambiente, or "Forests, Environment"). This project, proposed by the University of São Paulo as a mitigation strategy to global warming, identified 20,148,000 ha with "potential for reforestation," of which 71.8% would be for industrial plantations, 14.4% for corrective afforestation, and 13.8% for "mixed" reforestation.19 The 20 Mha total represents 12.6% of the landscape in the zones selected for the program. Excluding Amazonia and semiarid Northeast Brazil, the zones selected for the program represent, very approximately, one-third of the land area in the remainder of the country (i.e., "Southern Brazil").
The initial yields have been scaled back from the expectations of the FLORAM project, which predicted yields on the best land for industrial plantations of 49.5 m3 ha-1, or about 40% higher than the 30.2 m3 ha-1 14 now obtained by major companies. The ratio of the two has been used to adjust the yields.
As plantation areas expand, biological factors would also contribute to declining yields. Problems with pests and diseases would increase with greater plantation areas. The number of pest species increases in proportion to area of plantations as local insects adapt or evolve to exploit the new resource. In eucalyptus in Minas Gerais, a significant positive relationship has been found between the areas of plantations in each município (county) and the severity of insect pest outbreaks.20 This general phenomenon has been clearly shown in cacao.21 In addition, the longer an exotic species is present in a new area (such as eucalyptus in Brazil), the greater the load of pests independent of planted area, as has been shown for sugar cane.22
The financial attractiveness of plantations can be expected to diminish as expansion of areas leads to yield decline. These limitations, however, do not pose a clear circumscription on plantation expansion in Brazil because of its vast land area. Were markets available and prices sufficient to justify inputs, much larger areas could be planted than are considered for the FLORAM project.
The FLORAM proposal is quite detailed in its treatment of silvicultural potential in Southern Brazil, but does not attempt the same comprehensiveness for the Northeast and Amazon regions. Of 14.5 X 10⁶ ha classified for industrial plantations by FLORAM, 12.7 X 10⁶ ha (88%) are in Southern Brazil, 0.5 X 10⁶ ha (3%) are in the Northeast, and 1.3 X 10⁶ ha (9%) are in Amazonia (calculated from Ab'Sáber et al. 199019 [pp. 88, 99-102]). Extrapolation from the small areas surveyed by FLORAM to larger areas in Amazonia and the Northeast introduces substantial uncertainty. A study such as FLORAM's survey in Southern Brazil would be necessary for reliable estimation of the curve relating marginal yields to the expansion of plantation areas in Amazonia and the Northeast, but, unfortunately, such a study does not yet exist. For the Northeast, a zoning study done in the 1970s by the now-dissolved Program for Development and Research in Forestry (PRODEPEF) provides recommendations for silvicultural species by climatic zone, but does not quantify yields or areas available.23 A second volume finds that virtually all of Brazil is suitable for one or another species of eucalyptus.24
The scaling of the FLORAM data used here to all of Brazil is more complicated than one might think. Silvicultural companies and the industries they supply are reluctant to establish new bases of operation in distant and little-known areas like Amazonia. At present, silviculture is concentrated in Southern Brazil. Because of the high costs of transportation and land, pulp companies find it about as profitable to invest in technological improvements (such as clonal techniques) for marginal land in the state of São Paulo where production under normal management would be only 12 m3 ha-1 yr-1 as it is to bring wood from some sites in northern Minas Gerais where land can produce up to 40 m3 ha-1 yr-1.4 Established firms are averse to planting in distant areas because having a continuous area is a great advantage in facilitating administration of companies. This is only true up to a certain point: when firms reach a certain size they begin to suffer from various sources of inefficiency, and often split or find ways to subdivide the administration of their operations. Firms such as Suzano or Champion, each with about 100,000-ha plantations in the state of São Paulo, would find it difficult to double their areas even if land were readily available.
The traditional smoothly declining curve of marginal yield with increased cumulative area of plantations does not hold for expanding silviculture to new regions. Silvicultural decisions are not based solely on maximizing the expected yield in m3 ha-1 yr-1. Rather, the guiding factor is maximization of expected profit, with appropriate corrections for perceived risk. Were an indicator of profitability used rather than m3 ha-1 yr-1, one would expect a smooth decline with expansion of the plantations.
For sites identified for industrial plantations within the zones selected by the FLORAM Project in Southern Brazil, the yield is expected to decline with increasing area as shown in Fig. 4A.19 Relations of marginal yield to area expansion are given in Fig. 4B for the Northeast and Fig. 4C for the Amazon, based on portions of these regions surveyed by FLORAM.
[Figure 4 here]
The FLORAM proposal appears to be optimistic regarding the best marginal yields obtainable in Southern Brazil (49.4 m3 ha-1 yr-1) and in the Northeast (38.1 m3 ha-1 yr-1). At the same time, the best marginal yields indicated for Amazonia (17.7 m3 ha-1 yr-1) are lower than those implied by silviculture experiments being conducted by the Companhia Vale do Rio Doce (CVRD) at approximately 150 sites in the Carajás area. The areas proposed in the Northeast and in Amazonia represent very small fractions of the total land areas in these regions. It is the vastness of Brazil's territory, especially in Amazonia, that is the most salient fact with respect to potential expansion of silviculture. In order to capture this feature, at least in qualitative terms, available areas much larger than those used by FLORAM are considered here for Amazonia and the Northeast. In the case of the Northeast, substantial expansion of silviculture is likely over the coming decades because cacao, a major crop in high rainfall areas of the state of Bahía, is becoming less economically viable as a result of low prices. The global decline in cacao prices since 1977 was accurately predicted by the World Bank26 and is not likely to be reversed in time to save Brazil's cacao plantations. Spread of witches' broom, caused by the fungus Crinipellis perniciosa, is hastening the decline. The area considered here for the Northeast is 6.8 X 10⁶ ha (ten times the area classified by FLORAM), while the area for Amazonia is 142.6 X 10⁶ ha--approximately 100 X 106 ha of savannas27 plus 42.6 X 10⁶ ha deforested by 1991,28 giving a total 111 times greater than the 1.3 X 10⁶ ha in Amazonia classified by FLORAM. Of the deforested area in Amazonia, approximately 50.2% is in active uses such as agriculture or productive pasture, while 49.8% is either degraded pasture or secondary forest of different ages and origins.29 The area potentially "available" greatly exceeds the likely extent of plantation expansion by 2050.
The relationships that control the inter-regional shifts in planting must be specified, but this can only be done to reflect general impressions of how the shift is likely to occur. In the results presented here, it is assumed that planting is done in Southern Brazil (within the limits of available area) in proportion to the ratio of the available marginal yield in that region to the maximum available marginal yield in Amazonia and the Northeast. This relation is assumed to hold up to a maximum of 90% of the total planting: the proportion planted in Southern Brazil rises in a linear fashion from zero (at a marginal yield of zero) to 0.9 (at a marginal yield triple the maximum available elsewhere). The fraction of the planting outside Southern Brazil that is allotted to Amazonia is a minimum of 10% (for marginal yields in Amazonia less than or equal to those available in the Northeast), rising in a linear fashion to a maximum of 90% when the marginal yield in Amazonia is triple that available in the Northeast.
The balance between planting in the three regions is arrived at by first separating the new planting activity in Southern Brazil from the rest of the country (based on the marginal yield in Southern Brazil as compared to the best yield available elsewhere). The planting done outside Southern Brazil is divided between Amazonia and the Northeast based on the fraction of this planting that is done in Amazonia.
3.2. Simulation results
The model simulates a progression of planting activity shifting from Southern Brazil to the Northeast and then to the Amazon region (Fig. 5). While quantitative results must be regarded as tenuous, one can still arrive at important conclusions regarding the form of the relationship between area expansion and yield on a national scale. Because of jumps in marginal yield as plantation expansion shifts from one region to another, the relationship is not a monotonic decrease, but rather dips and then rises again, as in the simulated results in Fig. 6. The cumulative areas in these calculations are areas in addition to the initial (1990) plantation areas, which were approximately 6 X 10⁶ ha in Southern Brazil, 1 X 10⁶ ha in the Northeast and 0.17 X 10⁶ ha in Amazonia.
[Figures 5 and 6 here]
If the calculation is done assuming unimpeded movement among regions to plant land in decreasing order of marginal yield, a smooth-stepped decline in marginal yield with area expansion is, of course, obtained. With the explicit inclusion of inter-regional movements, the relationship (Fig. 6) shows the same general pattern for the first portion of the curve, reflecting the concentration of planting in Southern Brazil (through approximately 16 X 106 ha). The phenomenon of rising portions of the curve after inter-regional shifts (such as the "hump" reflecting the shift from Southern Brazil to the Northeast after cumulative plantation area reaches 18 X 106 ha in Fig. 6) is more pronounced if more optimistic yields are used in the calculation for the Northeast and, especially, for Amazonia. The assumed maximum marginal yield in Amazonia has the same value as the lower yields in the Northeast (Fig. 3), resulting in no hump appearing in Fig. 6 when planting activity shifts to Amazonia after cumulative plantation area reaches 28 X 106 ha (Fig. 5). It must be stressed that the lack of reliable parameterization for the Northeast and Amazonia makes only the form of the relationship meaningful at the national scale. The same form is likely to apply at a global scale for movements of plantation activity from traditional silvicultural areas (largely in the temperate zones) to tropical areas.
3.3. Implications for climate change impacts and responses
The foregoing calculations are based on a demand driven economy. In other words, they assume that domestic population demand and projected export quantities will be met, and calculate how this would be done, rather than allowing these product flows to be reduced should they become too expensive to maintain. In order to be used in assessing programs to subsidize silviculture as a response option to global warming, one must also have information on how the larger economy will respond to the changes. If subsidized silviculture merely replaces unsubsidized silviculture elsewhere, and/or if the wood products produced by the subsidized plantations replace products that would otherwise have been obtained from unsubsidized sources elsewhere, the net gain in carbon storage may be small or nonexistent.
The scenario derived here for plantation yield and area expansion up to the year 2050 is conservative in many ways, especially for the second half of this period. It assumes constant per-capita domestic demand for wood products (if Brazil's economy and affluence grow, per-capita demand may well increase). It also assumes that Brazil will have a constant share of exports to developed countries. In addition to competing for a greater share of existing markets, future developments in biomass use could present opportunities for Brazil to expand its plantations beyond the levels indicated by current projections of demand for wood products. Major advances have been made in perfecting hydrogen fuel cells as a replacement for the internal combustion engine. Prototypes such as shuttle buses at the Los Angeles International Airport provide visible demonstrations. One of the best carriers for hydrogen is methanol, which can be produced from biomass. Should hydrogen fuel cells become a significant substitute for liquid fossil fuels in transportation, this could greatly increase the world market for silviculture products by the 2050 time horizon considered in the current paper. Williams30 (1994) estimated that methanol derived from 300 X 106 ha of plantations could replace the world's present consumption of liquid fossil fuels.
The yield assumptions of the current paper include reduced productivity due to planting on more marginal lands, but do not include the impacts of climatic change. No climatic change is the appropriate assumption for a reference scenario for assessing climatic change impacts, but not for a reference scenario for assessing the effect of carbon-offset plantations. Reduced yields from all factors, including climatic change, would diminish the effectiveness of carbon-offset plantations.
Positive changes, such as technological advance in tree breeding, have also been omitted from the reference scenario. These changes could be equal in magnitude to yield declines from expansion onto more marginal lands, but could not negate the policy implications of per-hectare declines calculated as a result of lower quality of available lands, climatic change, or other factors. Caution would be indicated even if predicted positive and negative influences were of the same magnitude because negative impacts should best be approached on the basis of the precautionary principle (i.e., by assuming that the hypothetical negative changes will, in fact, take place), whereas it is wisest to treat future technological advances with a view to not "counting one's chickens before they hatch".
Expansion of silviculture on the scale indicated in the reference scenario developed here would have major social, as well as environmental, impacts. Evaluating these would require a reference scenario for the social impacts implied by the landcover changes suggested in the current paper. Studies of this kind are needed for Brazil to make informed decisions as it formulates proposals for plantation expansion as a response to global warming (e.g., under the Global Environment Facility or other programs). These studies are also needed for informed debate on how countries, power utilities and international agencies interested in funding global warming mitigation options should best spend their money. Projects undertaken as global warming mitigation options need to achieve both the objective of increasing carbon storage and the objective of promoting sustainable development in ways that contribute to the well-being of local populations.
4. CONCLUSIONS
The calculations in the present paper indicate very substantial increases in silvicultural plantations in Brazil by the year 2050 merely to meet present per-capita demands of Brazil's projected population and to export wood products at the levels indicated by population growth trends in the importing countries, assuming that Brazil's share of international trade remains unchanged. Without climatic change, Brazil's area of plantations in 2050 would be 3.2 times larger than the area in 1991 if the assumptions of the current analysis are accurate. These large areas of plantations imply substantial social and environmental changes.
ACKNOWLEDGMENTS--I thank Mário Ferreira and S.V. Wilson for comments on the manuscript. The Pew Scholars Program in Conservation and the Environment, the National Council of Scientific and Technological Development (CNPq AI 350230/97-98) and the National Institute for Research in the Amazon (INPA PPI 5-3150) provided financial support.
REFERENCES
1. FAO (Food
and Agricultural Organization of the United Nations), Forest Resources
Assessment 1990: Tropical Countries. FAO For. Pap. 112, Rome, Italy (1994).
2. Brazil, Governo de São Paulo, Fundação
Florestal, Plano de Desenvolvimento Florestal Sustentável. Governo de
São Paulo, Secretaria de Estado do Meio Ambiente, Fundação para a Conservação e
a Produção Florestal do Estado de São Paulo (Fundação Florestal), São Paulo,
Brazil (1993).
3. Luiz C.E. Rodrigues, Department of Forest
Science, Escola Superior de Agricultura "Luis de Queirroz" (ESALQ),
Piracicaba, São Paulo, Brazil, personal communication (1994).
4. Mário Ferreira, Department of Forest Science,
Escola Superior de Agricultura "Luis de Queirroz" (ESALQ),
Piracicaba, Sao Paulo, Brazil, personal communication (1994).
5. M. Ferreira, A contribuição do setor de sementes do LCF/IPEF para a silvicultura intensiva brasileira. IPEF Piracicaba 46, 8-31 (1993).
6. P.M. Fearnside, Jari at age 19: Lessons for Brazil's silvicultural plans at Carajás. Interciencia 13, 12-24; 13, 95 (1988).
7. E.
Campinhos Jr., Plantation of fast-growing species for tropical areas. Actes du 10e Congrès Forestier
Mondial Vol. 5, Revue Forestière Hors Série No. 511-120 (1991).
8. FAO (Food and Agriculture Organization of the United Nations), Forestry Statistics Today for Tomorrow: 1961-1991...2010. FAO, Rome, Italy (1993).
9. A.
Veríssimo, P. Barreto, M.M. Mattos, R. Tarifa and C. Uhl, Logging impacts and
prospects for sustainable forest management in an old Amazonian frontier: The
case of Paragominas. For.
Ecol. Manage. 55, 169-199 (1992).
10. Brazil, Governo de São Paulo, Fundação
Florestal and Fundo Florestar, Florestar Estatístico, Vol. 1, No. 3.
Governo de São Paulo, Secretaria de Estado do Meio Ambiente, Fundação para a
Conservação e a Produção Florestal do Estado de São Paulo (Fundação Florestal)
and Fundo de Desenvolvimento Florestal (Fundo Florestar), São Paulo, Brazil
(1993).
11. FAO (Food and Agriculture Organization of the United Nations), Forest Products Yearbook 1992. FAO, Rome, Italy (1994).
12. R.A.
Sedjo, The Comparative Economics of Plantation Forestry: A Global Assessment.
Resources for the Future,
Washington, DC, U.S.A. (1983).
13. Brazil, Presidência da República, Instituto Brasileiro de Geografia e Estatística (IBGE), Anuário Estatístico do Brasil 1989, Vol. 49. IBGE, Rio de Janeiro, Brazil (1989).
14. A.E. Carpentieri, E.D. Larsen and J. Woods, Future-biomass-based electricity supply in Northeast Brazil. Biomass and Bioenergy 4, 149-173 (1993).
15. UNDP (United Nations Development Programme), Integrated ecosystem management of the semiarid forests (caatinga) of the Northeastern region of Brazil. GEF Project Activity Initiation (AIB), UNDP, Brasília, Brazil (unpublished) nd [1993].
16. ABRACAVE (Associação Brasileira de Carvão
Vegetal), Anuário Estatístico. ABRACAVE, Belo Horizonte, Brazil (1993).
17. M.G.F. Reis, G.G. dos Reis, O.F. Valente and
H.A.C. Fernandes. Sequestro e armazenamento de carbono em florestas nativas e
plantadas dos estados de Minas Gerais e Espírito Santo, in Emissão e
Sequestro de CO2: Uma Nova Oportunidade de Negócios para o Brazil
(M. Reis and M. Borgonavi, Eds.), pp. 155-195. Companhia Vale do Rio Doce
(CVRD), Rio de Janeiro, Brazil (1994).
18. A. Baudin
and L. Lundberg, A world model for the demand for paper and paperboard. For. Sci. 33,
185-196 (1987).
19. A. Ab'Saber, J. Goldemberg, L. Rodés and W.
Zulauf, Identificação de áreas para o florestamento no espaço total do Brazil. Estudos
AVAN_ADOS 4, 63-119 (1990).
20. G.W.G. Moraes, P.G. Brun and L.A. Soares, Ocorrência de Lepidópteros desfolhadores de eucalipto em Minas Gerais e as perspectivas para o seu controle. Ciência e Cultura 34, suplemento, 575 (1982).
21. D.R. Strong Jr., Rapid asymptotic species accumulation in phytophagous insect communities: The pests of cacao. Science 185, 1064-1066 (1974).
22. D.R.
Strong Jr., E.D. McCoy and J.R. Rey, Time and the number of herbivorous
species: The pests of sugarcane. Ecology 58, 167-175 (1977).
23. L. Golfari and R.L. Carter, Zoneamento
Ecológico da Região Nordeste Para Experimentação Florestal. Projeto de
Desenvolvimento e Pesquisa Florestal (PRODEPEF) Série Técnica No. 10
(PNUD/FAO/IBDF/BRA-45), PRODEPEF, Instituto Brasileira de Desenvolvimento
Florestal (IBDF), Brasília, Brazil (1977).
24. L. Golfari, R.L. Caser and V.P.G. Moura, Zoneamento
Ecológico Esquemático para Reflorestamento no Brasil, 2a aproximação.
Projeto de Desenvolvimento e Pesquisa Florestal (PRODEPEF) Série Técnica No. 10
(PNUD/FAO/IBDF/BRA-45). PRODEPEF, Instituto Brasileira de Desenvolvimento
Florestal (IBDF), Brasília, Brazil (1978).
25. L. Couto and D.R. Betters, Short-rotation eucalypt plantations in Brazil: Social and environmental issues. Oak Ridge National Laboratories Technical Report ORNL/TM-12846, National Technical Information Service, Springfield, VA, U.S.A. (1995).
26. International Bank for Reconstruction and Development (World Bank), Brazil, Integrated Development of the Northwest Frontier. World Bank, Washington, DC, U.S.A. (1981).
27. P.M. Fearnside and J. Ferraz, A conservation gap analysis of Brazil's Amazonian vegetation. Cons. Biol. 9, 1-14 (1995).
28. P.M. Fearnside, Deforestation in Brazilian Amazonia: The effect of population and land tenure, Ambio 22, 537-545 (1993).
29. P.M. Fearnside, Amazonian deforestation and global warming: Carbon stocks in vegetation replacing Brazil's Amazon forest. For. Ecol. Manage. 80, 21-34 (1996).
30. R. Williams, BioResources and Energy: Overview. Presentation at BioResources '94: International Conference, Bangalore, India, 4 Oct. 1994 (1994).
FIGURE LEGENDS
Figure 1. Regions of Brazil and locations mentioned in the text. "Southern Brazil" refers to the portion that is neither Amazonian nor Northeastern.
Figure 2. A). Export of wood products from Brazil. Projections assume Brazil maintains a constant share of the world wood products trade, and that the global total increases in proportion to the population of non-tropical countries.
B). Domestic consumption of wood products. Projections assume constant per-capita consumption and continuation of decline in population growth rates.
Figure 3. Causal loop diagram of model for shifts of plantation establishment activity among regions of Brazil. Signs indicate the direction of change in the quantity at the head of the arrow given an increase in the quantity at the tail of the arrow.
Figure 4. Marginal and cumulative yields of plantations with expansion of plantation area in Brazil (based on FLORAM data): A) Southern Brazil, B) the Northeast, C) Amazonia. Yields decline monotonically within each region as increments to plantation areas encompass progressively less productive sites.
Figure 5. Simulated areas of plantations maintained in each region, showing the shift of planting activity from Southern Brazil to the Northeast and to Amazonia.
Figure 6. Simulated results of the relation of marginal and cumulative yields to plantation area expansion. Marginal yields fall as the better sites in Southern Brazil are occupied, but rise as planting shifts to the Northeast, after which the downward trend resumes.
|
|
|
|
|
|
|
|
|
|
|
|
|
|
|
|
|
|
|
|
|
|||||||||||||||||||||||||||||||||||||||||
|
TABLE 1:
CLASSIFICATION OF WOOD PRODUCTS BY USE AND CONSUMER IN BRAZIL (1991) |
|
|||||||||||||||||||||||||||||||||||||||||||||||||||||||||||
|
|
|
|
|
|
|
|
|
|
|
|
|
|
|
|
|
|
|
|
||||||||||||||||||||||||||||||||||||||||||
|
Category |
Product |
|
Amount of product in 1991 |
|
|
|
|
Roundwood equivalent |
|
|
|
|
||||||||||||||||||||||||||||||||||||||||||||||||
|
|
|
|
Units |
Pro- duced |
Impor- ted |
Expor- ted |
Repro- cessed |
Domes-tic con- sump- tion (all sour- ces) |
Domes- tic con- sump‑ tion (domes- tic sour- ces) |
Units |
Conver- sion to round- wood |
Produced |
Impor- ted |
Expor- ted |
Repro- cessed |
Domes- tic con- sump- tion (all sour- ces) |
Domes- tic con- sump- tion (domes- tic sour- ces) |
|
|
|||||||||||||||||||||||||||||||||||||||||
|
|
|
|
|
|
|
|
|
|
|
|
|
|
|
|
|
|
|
|
|
|||||||||||||||||||||||||||||||||||||||||
|
Sawlogs or equi- valent |
Sawnwood |
|
103 m3 |
17,179a |
265a |
479b |
0a |
16,965a |
16,700a |
103 m3 |
2.13c |
36,551 |
564 |
1,019 |
0 |
36,096 |
35,532 |
|
|
|||||||||||||||||||||||||||||||||||||||||
|
|
|
|
|
|
|
|
|
|
|
|
|
|
|
|
|
|
|
|
|
|||||||||||||||||||||||||||||||||||||||||
|
|
Wood-based panels |
103 m3 |
2,892a |
44a |
616a |
0a |
2,319a |
2,275a |
103 m3 |
2.06d |
5,944 |
90 |
1,266 |
0 |
4,766 |
4,676 |
|
|
||||||||||||||||||||||||||||||||||||||||||
|
|
|
|
|
|
|
|
|
|
|
|
|
|
|
|
|
|
|
|
|
|||||||||||||||||||||||||||||||||||||||||
|
|
Roundwood (Int'l. trade) |
103 m3 |
73a |
119a |
73e |
119a |
0 |
0 |
103 m3 |
1.00 |
73 |
119 |
73 |
119 |
0 |
0 |
|
|
||||||||||||||||||||||||||||||||||||||||||
|
|
|
|
|
|
|
|
|
|
|
|
|
|
|
|
|
|
|
|
|
|||||||||||||||||||||||||||||||||||||||||
|
|
Logs or equivalent subtotal: |
|
|
|
|
|
|
103 m3 |
|
142,568 |
773 |
2,358 |
119 |
40,862 |
40,207 |
|
|
|||||||||||||||||||||||||||||||||||||||||||
|
|
|
|
|
|
|
|
|
|
|
|
|
|
|
|
|
|
|
|
|
|||||||||||||||||||||||||||||||||||||||||
|
|
|
|
|
|
|
|
|
|
|
|
|
|
|
|
|
|
|
|
|
|||||||||||||||||||||||||||||||||||||||||
|
Fuel & pulpwood or equi‑ valent |
Wood pulp |
|
103 t |
4,714a |
0a |
1,057a |
671f |
2,986a |
2,986a |
103 m3 |
4.70g |
22,156 |
0 |
4,968 |
3,156 |
14,032 |
14,032 |
|
|
|||||||||||||||||||||||||||||||||||||||||
|
|
|
|
|
|
|
|
|
|
|
|
|
|
|
|
|
|
|
|
|
|||||||||||||||||||||||||||||||||||||||||
|
|
Paper (int'l. trade) |
103 t |
‑‑‑ |
234a |
840a |
0a |
234a |
0a |
103 m3 |
3.76h |
0 |
879 |
3,156 |
0 |
879 |
0 |
|
|
||||||||||||||||||||||||||||||||||||||||||
|
|
|
|
|
|
|
|
|
|
|
|
|
|
|
|
|
|
|
|
|
|||||||||||||||||||||||||||||||||||||||||
|
|
Firewood |
|
103 m3 |
172,023a |
0a |
0a |
0a |
172,023a |
172,023a |
103 m3 |
1.00 |
172,023 |
0 |
0 |
0 |
172,023 |
172,023 |
|
|
|||||||||||||||||||||||||||||||||||||||||
|
|
|
|
|
|
|
|
|
|
|
|
|
|
|
|
|
|
|
|
|
|||||||||||||||||||||||||||||||||||||||||
|
|
Charcoal for locally consumed end products |
103 t |
1,949i |
‑‑‑ |
0i |
‑‑‑ |
1,949i |
1,949i |
103 m3 |
3.00j |
5,847 |
0 |
0 |
0 |
5,847 |
5,847 |
|
|
||||||||||||||||||||||||||||||||||||||||||
|
|
|
|
|
|
|
|
|
|
|
|
|
|
|
|
|
|
|
|
||||||||||||||||||||||||||||||||||||||||||
|
|
|
|
|
|
|
|
|
|
|
|
|
|
|
|
|
|
|
|
|
|||||||||||||||||||||||||||||||||||||||||
|
|
Charcoal for export and exported iron & steel |
103 t |
1,312i |
‑‑‑ |
1,312i |
‑‑‑ |
0i |
0i |
103 m3 |
3.00j |
3,935 |
0 |
3,935 |
0 |
0 |
0 |
|
|
||||||||||||||||||||||||||||||||||||||||||
|
|
|
|
|
|
|
|
|
|
|
|
|
|
|
|
|
|
|
|
||||||||||||||||||||||||||||||||||||||||||
|
|
|
|
|
|
|
|
|
|
|
|
|
|
|
|
|
|
|
|
|
|||||||||||||||||||||||||||||||||||||||||
|
|
Fuel and pulp subtotal: |
|
|
|
|
|
|
103 m3 |
|
203,961 |
879 |
12,059 |
3,156 |
192,782 |
191,903 |
|
|
|||||||||||||||||||||||||||||||||||||||||||
|
|
|
|
|
|
|
|
|
|
|
|
|
|
|
|
|
|
|
|
|
|||||||||||||||||||||||||||||||||||||||||
|
Grand Total |
|
|
|
|
|
|
|
|
103 m3 |
|
246,529 |
1,652 |
14,417 |
3,275 |
233,643 |
232,110 |
|
|
||||||||||||||||||||||||||||||||||||||||||
|
|
|
|
|
|
|
|
|
|
|
|
|
|
|
|
|
|
|
|
|
|||||||||||||||||||||||||||||||||||||||||
a FAO8.
b Illegally
exported sawnwood is believed to indicate a much higher total.
c Verissimo et
al. (1992)9.
d Wood-based panels
value is a weighted average for state of São Paulo 1993 production of
fiberhardboard (570 X 103 t installed capacity potentially consuming
2280 X 103 steres of wood) and particleboard (238 X 103 t
installed capacity potentially consuming 595 X 103 steres of wood),
using conversion for eucalyptus of 577.6 kg wood per stere10 (pp. 11
and 53). "Steres" are m3
of stacked wood, including the air spaces between the pieces. Densities of roundwood and wood‑based
panels are assumed to be equal.
e FAO (1994)11
Forest Products Yearbook 1992 value for 1991 roundwood exports used (73 X 103
m3). FAO8 gives
the much lower value of 4 X 10³ m3. Other values are from FAO8. Illegally exported roundwood believed to
indicate a substantially higher total.
f Reprocessed
wood value for exported wood only, calculated from paper export value and
conversions for paper/roundwood and pulp/roundwood.
g Sedjo (1983)12
(p. 147).
h Based on pulp
to roundwood conversion and FAO statistics8 for paper and paperboard
production (4888 X 103 t) and for pulp (4714 X 103 t
woodpulp produced + 125 X 103 t other fiber pulps ‑ 1057 X 103
t exported pulp). See Table 4.
i Total charcoal
production from FAO8.
Charcoal use for local endproducts is 32.7%, based on charcoal use in
1987 (86.3% used in industrial sector, Table 5). Export of iron and steel products in 1988
(37.9% of total production used domestically, based on Brazil, IBGE (1989)13
(pp. 381 and 604). These figures
represent a reduction over 1987, when 54.5% of iron and steel production was
used domestically and 47.0% of charcoal had domestic end uses.
j Assumes 1.5 m3
wood per m3 charcoal and 0.5 t charcoal per m3 charcoal
(values derived from FAO8).
Table 2. Sources of Wood Supply in Brazil (1991).
Area of Area Yield on Regen‑ Rotation Round‑
Category Source of land use harvested harvest eration length wood or
supply (103 ha) in 1991 (m3 ha-1 (m3 ha-1 (years) equivalent
(103 ha) harv- of land (103 m3)
ested) use yr-1)
‑‑‑‑‑‑‑‑‑ ‑‑‑‑‑‑‑‑‑‑‑‑‑‑‑‑‑ ‑‑‑‑‑‑‑‑‑ ‑‑‑‑‑‑‑‑‑‑‑ ‑‑‑‑‑‑‑‑‑ ‑‑‑‑‑‑‑‑‑‑‑ ‑‑‑‑‑‑‑‑‑ ----------------
Sawlogs Logging 1,778a 20b ‑‑‑ ‑‑‑ 35,568c
or
equiv- Long‑rotation 350d 29e 240f 20b 12b 7,000f
alent plantations
Roundwood imports 119c
Sawnwood imports 564c
Wood‑based panel imports 90c
Sawlogs or equivalent subtotal: 43,341
Pulp and Logging for firewood 1b 75b ‑‑‑ ‑‑‑ 100g
firewood
or equiv- Sawmill scraps 4,512h
alent
Short‑rotation 6,650d 1,108e 181f 30.21i 6b 200,925f
plantations
Firewood collection 58,919j
Paper imports 234k
Pulpwood and firewood subtotal: 264,690
Grand total: 308,031
‑‑‑‑‑‑‑‑‑‑‑‑‑‑‑‑‑‑‑‑‑‑‑‑‑‑‑‑‑‑‑‑‑‑‑‑‑‑‑‑‑‑‑‑‑‑‑‑‑‑‑‑‑‑‑‑‑‑‑‑‑‑‑‑‑‑‑‑‑‑‑‑‑‑‑‑‑‑‑‑‑‑‑‑‑‑‑‑‑‑‑-----
a Roundwood yield from harvest.
b Assumption.
c Derived in Table 1.
d Assumed 5% of Brazil's 7 X 10⁶ ha of plantations8 are long rotation.
e Calculated from the cumulative area planted one rotation-length before 1991, based on
the 1981-1990 plantation expansion rate (long- + short-rotation) of 279.2 X 10³ ha yr-1 8.
f Area harvested multiplied by yield.
g Estimate of fuelwood derived from natural forest logging represents wood used for
charcoal in Grande Carajás and hogfuel at Jari and at thermoelectric plants such as Ariquemes and
Manacapuru.
h Assumed 20% of sawmill scraps (from logging + long‑rotation plantations) is recycled
as charcoal or firewood.
i Average commercial eucalyptus yield (SD=10.12, n=7 estates) in Minas Gerais and
Northeast Brazil (Ref. 14, p. 159).
j A rough estimate, summing estimate of 50 X 106 m3 for 1992 for the Northeast region
(Ref. 15, p. 7) with charcoal manufacture using 8.8 X 10⁶ m3 solid wood derived from native forest
in Minas Gerais in 1992 (calculated from ABRACAVE (1993) (Ref. 16) as cited by Reis et al. (1994)
(Ref. 17), and 0.1 X 10⁶ m3 solid wood for charcoal from native forest in São Paulo in 1989
(calculated from Brazil, Governo de São Paulo,
Fundação Florestal & Fundo Florestar (1993) (Ref.
10, p. 54) assuming 0.5 t charcoal per t solid wood (both dry weight). Northeast Brazil estimate
may be an exaggeration, compensating for omission of other regions.
k Derived in Table 4.
Table
3. Brazilian domestic sources of wood
supply (1991).
Sawlogs or equivalent Pulp and firewood or equivalent All
‑‑‑‑‑‑‑‑‑‑‑‑‑‑‑‑‑‑‑‑‑‑‑‑‑‑‑ ‑‑‑‑‑‑‑‑‑‑‑‑‑‑‑‑‑‑‑‑‑‑‑‑‑‑‑‑‑‑‑‑‑‑‑‑‑‑‑‑‑‑‑‑‑- domestic
Logging Planta‑ Total
Logging Sawmill Firewood
Planta- Total wood
tions scraps collec-
tions
tion
‑‑‑‑‑‑‑‑‑‑‑‑‑‑‑‑‑‑‑‑‑‑‑‑‑‑‑‑‑‑‑‑‑‑‑‑‑‑‑‑ ‑‑‑‑‑‑‑‑‑‑‑‑‑‑‑‑‑‑‑‑‑‑‑‑‑‑‑‑‑‑‑‑‑‑‑‑‑‑‑‑‑‑‑‑‑- ‑‑‑‑‑‑‑‑‑‑
Amount
(106
m3 35.6a 7.0a 42.6a 0.1a 4.5a 58.9a 200.9a 264.5
307.0
roundwood
equivalent)
‑‑‑‑‑‑‑‑‑‑‑‑‑‑‑‑‑‑‑‑‑‑‑‑‑‑‑‑‑‑‑‑‑‑‑‑‑‑‑‑ ‑‑‑‑‑‑‑‑‑‑‑‑‑‑‑‑‑‑‑‑‑‑‑‑‑‑‑‑‑‑‑‑‑‑‑‑‑‑‑‑‑‑‑‑‑ ‑‑‑‑‑‑‑‑‑‑
Share
of
category
(%) 83.6 16.4
100.0 0.0 1.7
22.3 76.0 100.0
‑‑‑‑‑‑‑‑‑‑‑‑‑‑‑‑‑‑‑‑‑‑‑‑‑‑‑‑‑‑‑‑‑‑‑‑‑‑‑‑ ‑‑‑‑‑‑‑‑‑‑‑‑‑‑‑‑‑‑‑‑‑‑‑‑‑‑‑‑‑‑‑‑‑‑‑‑‑‑‑‑‑‑‑‑‑ ‑‑‑‑‑‑‑‑‑‑
Share
of
all
domestic 11.6 2.3
13.9 0.0 1.5
19.2 65.4 86.1
100.0
wood
(%)
‑‑‑‑‑‑‑‑‑‑‑‑‑‑‑‑‑‑‑‑‑‑‑‑‑‑‑‑‑‑‑‑‑‑‑‑‑‑‑‑ ‑‑‑‑‑‑‑‑‑‑‑‑‑‑‑‑‑‑‑‑‑‑‑‑‑‑‑‑‑‑‑‑‑‑‑‑‑‑‑‑‑‑‑‑‑ ‑‑‑‑‑‑‑‑‑‑
a Derived in Table 1.
Table 4. Brazilian pulp and paper sector in 1991
Conversion
Amount (103 t)a factor
‑‑‑‑‑‑‑‑‑‑‑‑‑‑‑‑‑‑‑‑‑‑‑‑‑‑‑‑‑‑‑‑‑‑‑‑‑‑‑‑‑‑‑‑‑ to round-
Produc- Import Export Reproc‑ Consump- wood
tion essing tion equivalent
‑‑‑‑‑‑‑‑‑‑‑‑‑‑‑‑‑‑‑‑‑‑‑‑‑‑‑‑‑‑‑‑‑‑‑‑‑‑‑‑‑‑‑‑‑‑‑‑‑‑‑‑‑‑‑‑‑‑‑‑‑‑‑‑‑‑‑‑‑‑‑‑‑‑‑‑‑‑
Wood pulp 4,714 0 1,057 3,782 0
Non-wood pulp 125 0 0 125 0
Recycled paper 5,148 0 0 5,148 0
Paper & paperboard 4,888 234 840 0 4,282
‑‑‑‑‑‑‑‑‑‑‑‑‑‑‑‑‑‑‑‑‑‑‑‑‑‑‑‑‑‑‑‑‑‑‑‑‑‑‑‑‑‑‑‑‑‑‑‑‑‑‑‑‑‑‑‑‑‑‑‑‑‑‑‑‑‑‑‑‑‑‑‑‑‑‑‑‑‑
Roundwood equivalents (103 m3)
‑‑‑‑‑‑‑‑‑‑‑‑‑‑‑‑‑‑‑‑‑‑‑‑‑‑‑‑‑‑‑‑‑‑‑‑‑‑‑‑‑‑‑‑‑‑‑‑‑‑‑‑‑‑‑‑‑‑‑‑‑‑‑‑‑‑‑‑‑‑‑‑‑‑‑‑‑‑
Wood pulp 22,156 0 4,968 17,775 0 4.70b
Non-wood pulp 588 0 0 588 0 4.70c
Recycled paper 15,472 0 0 15,472 0 3.01d
Paper & paperboard 18,363 879 3,156 0 16,086 3.76e
Total roundwood: 56,578 879 8,124 33,835 16,086f
‑‑‑‑‑‑‑‑‑‑‑‑‑‑‑‑‑‑‑‑‑‑‑‑‑‑‑‑‑‑‑‑‑‑‑‑‑‑‑‑‑‑‑‑‑‑‑‑‑‑‑‑‑‑‑‑‑‑‑‑‑‑‑‑‑‑‑‑‑‑‑‑‑‑‑‑‑‑
a FAO (1993).8
b Sedjo (1983).12
c Assumed equal to wood pulp.
d Assumed 80% yield from recycled paper.
e The FAO (1993) value8 for amount of recycling appears very high.
Calculations assume non‑wood pulp includes recycled paper.
f Domestic annual consumption per capita of 110.9 m3 roundwood per 1000 inhabitants is equivalent to 29.5 t paper per 1000 inhabitants.
Table
5. Use of firewood and charcoal in
Brazil.
Sector Consumption
‑‑‑‑‑‑‑‑‑‑‑‑‑‑‑‑‑‑‑‑‑‑‑‑‑‑‑ ‑‑‑‑‑‑‑‑‑‑‑‑‑‑‑‑‑‑‑‑‑‑‑‑‑‑‑ 1987: sector
Charcoal (103 t)a Firewood (103 m3)b percent of total
‑‑‑‑‑‑‑‑‑‑‑‑‑‑‑‑‑‑‑‑‑‑‑‑‑‑‑ ‑‑‑‑‑‑‑‑‑‑‑‑‑‑‑‑‑‑‑‑‑‑‑‑‑‑‑ ‑‑‑‑‑‑‑‑‑‑‑‑‑‑‑‑‑‑-
1972 1987
% change 1972 1987
% change Charcoal Firewood
‑‑‑‑‑‑‑‑‑‑‑‑‑‑‑‑‑‑‑‑‑‑‑‑‑‑‑‑‑‑‑‑‑‑‑‑‑‑‑‑‑‑‑‑‑ ‑‑‑‑‑‑‑‑‑‑‑‑‑‑‑‑‑‑‑‑‑‑‑‑‑‑‑ ‑‑‑‑‑‑‑‑‑‑‑‑‑‑‑‑‑‑-
Energy 0 0
0.0 0 0
0.0 0
0
Residential 776 1,148
48.0 176,342 84,284
‑52.2 12.48 50.52
Commercial 53 86
62.9 1,730 1,410
‑18.5 0.93 0.85
Public 0 0
0.0 132 28
‑78.6 0.00 0.02
Agricultural 0 0
0.0 42,001 25,597
‑39.1 0.00 15.34
Transport 0 0
0.0 320 19
‑94.1 0.00 0.01
Industrial 2,230 7,940
256.0 37,451 55,500
48.2 86.29 33.27
Totalc 3,086 9,202
198.1 257,975 166,838
‑35.3 100 100
‑‑‑‑‑‑‑‑‑‑‑‑‑‑‑‑‑‑‑‑‑‑‑‑‑‑‑‑‑‑‑‑‑‑‑‑‑‑‑‑‑‑‑‑‑ ‑‑‑‑‑‑‑‑‑‑‑‑‑‑‑‑‑‑‑‑‑‑‑‑‑‑‑ ‑‑‑‑‑‑‑‑‑‑‑‑‑‑‑‑‑‑
Sector Per‑capita consumption
‑‑‑‑‑‑‑‑‑‑‑‑‑‑‑‑‑‑‑‑‑‑‑‑‑‑‑ ‑‑‑‑‑‑‑‑‑‑‑‑‑‑‑‑‑‑‑‑‑‑‑‑‑‑‑
Charcoal (t capita-1
yr-1) Firewood (m3
capita-1 yr-1)
‑‑‑‑‑‑‑‑‑‑‑‑‑‑‑‑‑‑‑‑‑‑‑‑‑‑‑ ‑‑‑‑‑‑‑‑‑‑‑‑‑‑‑‑‑‑‑‑‑‑‑‑‑‑‑
1972 1987 % change 1972
1987 % change
‑‑‑‑‑‑‑‑‑‑‑‑‑‑‑‑‑‑‑‑‑‑‑‑‑‑‑‑‑‑‑‑‑‑‑‑‑‑‑‑‑‑‑‑‑ ‑‑‑‑‑‑‑‑‑‑‑‑‑‑‑‑‑‑‑‑‑‑‑‑‑‑‑
Energy 0 0
0 0 0
0
Residential 0.0079 0.0081
2.2 0.2895 0.0955
‑67.0
Commercial 0.0005 0.0006
12.4 0.0028 0.0016
‑43.7
Public 0 0
0 0.0002 0.0000
‑85.2
Agricultural 0 0
0 0.0689 0.0290
‑57.9
Transport 0 0
0 0.0005 0.0000
‑95.9
Industrial 0.0228 0.0561
145.8 0.0615 0.0629
2.3
Totald 0.0316 0.0651
105.8 0.4235 0.1891
‑55.3
‑‑‑‑‑‑‑‑‑‑‑‑‑‑‑‑‑‑‑‑‑‑‑‑‑‑‑‑‑‑‑‑‑‑‑‑‑‑‑‑‑‑‑‑‑ ‑‑‑‑‑‑‑‑‑‑‑‑‑‑‑‑‑‑‑‑‑‑‑‑‑‑‑
Sector Percent of energy use in sector
‑‑‑‑‑‑‑‑‑‑‑‑‑‑‑‑‑‑ ‑‑‑‑‑‑‑‑‑‑‑‑‑‑‑‑‑‑
Charcoal Firewood
‑‑‑‑‑‑‑‑‑‑‑‑‑‑‑‑‑‑ ‑‑‑‑‑‑‑‑‑‑‑‑‑‑‑‑‑‑
1972 1987 1972 1987
‑‑‑‑‑‑‑‑‑‑‑‑‑‑‑‑‑‑‑‑‑‑‑‑‑‑‑‑‑‑‑‑‑‑‑‑ ‑‑‑‑‑‑‑‑‑‑‑‑‑‑‑‑‑‑
Energy 0 0 0 0
Residential 2.1 3.0 77.6 35.2
Commercial 1.5 0.9 8.0 2.3
Public 0 0 0.9 0.1
Agricultural 0
0 83.4 35.7
Transport 0 0 0.2 0.0
Industrial 5.8 8.0 15.7 9.0
Total 2.7 4.0 35.5 11.5
‑‑‑‑‑‑‑‑‑‑‑‑‑‑‑‑‑‑‑‑‑‑‑‑‑‑‑‑‑‑‑‑‑‑‑‑‑‑‑‑‑‑‑‑‑ ‑‑‑‑‑‑‑‑‑‑‑‑‑‑‑‑‑‑-
a Charcoal converted from petroleum equivalents13 (pp.
450-452) using 1.51 t charcoal per t petroleum,
considering
1987 total production of 9,202 X 103 t of charcoal13 (p.
335).
b Firewood converted from petroleum equivalents13 (pp.
450-452) using 9.40 m3 t-1 petroleum, considering
1987
total production of 166,838 X 103 m3 of firewood13
(p. 335).
c Consumption totals13 (pp. 450-452) vary slightly from
disaggregated data.
d Per capita consumption based on 1987 population of 141.552 X 10⁶
(projected from 1980 census by Brazil,
IBGE13
[p. 75]) and 1972 population of 97.663 X 10⁶ projected at 2.4% yr-1
from 1970 census.
Fig. 1
Fig. 2
Fig. 3
Fig. 4
Fig. 5
Fig. 6