Table I:
Terrestrial Ecoregions of South America
|
|
|
|
|
|
|
|
|
|
|
|||||||||||||||||||
|
Major Ecosystem
type |
Major Habitat
type |
Bioregion |
Ecoregion Name |
Ecoregion No. |
Countries |
Original area
(km2) |
Conservation
status |
Biological
distinctiveness |
Bidiversity
priority |
|||||||||||||||||||
|
TROPICAL
BROADLEAF FORESTS |
||||||||||||||||||||||||||||
|
|
Tropical Moist
Broadleaf Forests |
|||||||||||||||||||||||||||
|
|
|
Orinoco
Tropical Moist Forests |
|
|||||||||||||||||||||||||
|
|
|
|
Cordillera La
Costa montane forests |
17 |
Venezuela |
13,481 |
3 |
2 |
I |
|||||||||||||||||||
|
|
|
|
Orinoco Delta
swamp forests |
18 |
Venezuela,
Guyana |
31,698 |
4 |
3 |
III |
|||||||||||||||||||
|
|
|
|
Guianan
Highlands moist forests |
20 |
Venezuela,
Brazil, Guyana |
248,018 |
5 |
2 |
III |
|||||||||||||||||||
|
|
|
|
Tepuis |
21 |
Venezuela, Brazil, Guyana, Suriname, Colombia |
49,157 |
5 |
1 |
II |
|||||||||||||||||||
|
|
|
|
Napo moist
forests |
22 |
Peru, Ecuador,
Colombia |
369,847 |
4 |
1 |
I |
|||||||||||||||||||
|
|
|
Amazonian
Tropical Moist Forests |
|
|
|
|
||||||||||||||||||||||
|
|
|
|
Macarena
montane forests |
23 |
Colombia |
2,366 |
3 |
2 |
I |
|||||||||||||||||||
|
|
|
|
Japurá/Negro
moist forests |
24 |
Colombia,
Venezuela, Brazil |
718,551 |
5 |
1 |
II |
|||||||||||||||||||
|
|
|
|
Uatumã moist
forests |
25 |
Brazil,
Venezuela, Guyana |
288,128 |
4 |
3 |
III |
|||||||||||||||||||
|
|
|
|
Amapá moist
forests |
26 |
Brazil,
Suriname |
195,120 |
4 |
3 |
III |
|||||||||||||||||||
|
|
|
|
Guianan moist
forests |
27 |
Veneauela,
Guyana, Suriname, Brazil, French Guiana |
457,017 |
4 |
3 |
III |
|||||||||||||||||||
|
|
|
|
Paramaribo
swamp forests |
28 |
Suriname |
7,760 |
3 |
3 |
III |
|||||||||||||||||||
|
|
|
|
Ucayali moist
forests |
29 |
Brazil, Peru |
173,527 |
2 |
1 |
I |
|||||||||||||||||||
|
|
|
|
Western
Amazonian swamp forests |
30 |
Peru, Colombia |
8,315 |
4 |
1 |
I |
|||||||||||||||||||
|
|
|
|
Southwestern
Amazonian moist forests |
31 |
Brazil, Peru,
Bolivia |
534,316 |
4 |
1 |
I |
|||||||||||||||||||
|
|
|
|
Juruá moist
forests |
32 |
Brazil |
361,055 |
5 |
2 |
III |
|||||||||||||||||||
|
|
|
|
Várzea forests |
33 |
Brazil, Peru,
Colombia |
193,129 |
3 |
1 |
I |
|||||||||||||||||||
|
|
|
|
Purús/Madeira
moist forests |
34 |
Brazil |
561,765 |
4 |
4 |
IV |
|||||||||||||||||||
|
|
|
|
Rondônia/Mato
Grosso moist forests |
35 |
Brazil, Bolivia |
645,089 |
3 |
2 |
II |
|||||||||||||||||||
|
|
|
|
Beni swamp and
gallery forests |
36 |
Bolivia |
31,329 |
4 |
4 |
IV |
|||||||||||||||||||
|
|
|
|
Tapajós/Xingu
moist forests |
37 |
Brazil |
630,905 |
3 |
4 |
IV |
|||||||||||||||||||
|
|
|
|
Tocantins moist
forests |
38 |
Brazil |
279,419 |
2 |
4 |
III |
|||||||||||||||||||
|
|
|
Northern Andean
Tropical Moist Forests |
|
|
|
|
||||||||||||||||||||||
|
|
|
|
Chocó/Darién
moist forests |
39 |
Colombia,
Panama, Ecuador |
82,079 |
3 |
1 |
I |
|||||||||||||||||||
|
|
|
|
Eastern
Panamanian montane forests |
40 |
Panama,
Colombia |
2,905 |
2 |
1 |
I |
|||||||||||||||||||
|
|
|
|
Northwestern
Andean montane forests |
41 |
Colombia,
Ecuador |
52,937 |
2 |
1 |
I |
|||||||||||||||||||
|
|
|
|
Western Ecuador
moist forests |
42 |
Ecuador,
Colombia |
40,218 |
1 |
2 |
I |
|||||||||||||||||||
|
|
|
|
Cauca Valley
montane forests |
43 |
Colombia |
32,412 |
1 |
1 |
I |
|||||||||||||||||||
|
|
|
|
Magdalena
Valley montane forests |
44 |
Colombia |
49,322 |
1 |
1 |
I |
|||||||||||||||||||
|
|
|
|
Magdalena/Urabá
moist forests |
45 |
Colombia |
73,660 |
2 |
3 |
II |
|||||||||||||||||||
|
|
|
|
Cordillera
Oriental montane forests |
46 |
Colombia |
66,712 |
3 |
1 |
I |
|||||||||||||||||||
|
|
|
|
Eastern
Cordillera Real montane forests |
47 |
Ecuador,
Colombia, Peru |
84,442 |
3 |
1 |
I |
|||||||||||||||||||
|
|
|
|
Santa Marta
montane forests |
48 |
Colombia |
4,707 |
3 |
2 |
I |
|||||||||||||||||||
|
|
|
|
Venezuelan
Andes montane forests |
49 |
Venezuela,
Colombia |
16,638 |
2 |
1 |
I |
|||||||||||||||||||
|
|
|
|
Catatumbo moist
forests |
50 |
Venezuela,
Colombia |
21,813 |
1 |
4 |
III |
|||||||||||||||||||
|
|
|
Central Andean
Tropical Moist Forests |
|
|
|
|
||||||||||||||||||||||
|
|
|
|
Peruvian Yungas |
51 |
Peru |
188,735 |
2 |
1 |
I |
|||||||||||||||||||
|
|
|
|
Bolivian Yungas |
52 |
Bolivia,
Argentina |
72,517 |
2 |
2 |
I |
|||||||||||||||||||
|
|
|
|
Andean Yungas |
53 |
Argentina,
Bolivia |
55,457 |
3 |
3 |
III |
|||||||||||||||||||
|
|
|
Eastern South
American Tropical Moist Forests |
|
|
|
|
||||||||||||||||||||||
|
|
|
|
Brazilian
Coastal Atlantic forests |
54 |
Brazil |
233,266 |
1 |
1 |
I |
|||||||||||||||||||
|
|
|
|
Brazilian
Interior Atlantic forests |
55 |
Brazil |
803,908 |
2 |
2 |
I |
|||||||||||||||||||
|
|
Tropical Dry
Broadleaf Forests |
|
|
|
|
|||||||||||||||||||||||
|
|
|
Orinoco
Tropical Dry Forests |
|
|
|
|
||||||||||||||||||||||
|
|
|
|
Llanos dry
forests |
74 |
Venezuela |
44,177 |
2 |
4 |
III |
|||||||||||||||||||
|
|
|
Amazonian
Tropical Dry Forests |
|
|
|
|
||||||||||||||||||||||
|
|
|
|
Bolivian
Lowland dry forests |
76 |
Bolivia, Brazil |
156,814 |
1 |
1 |
I |
|||||||||||||||||||
|
|
|
Northern Andean
Tropical Dry Forests |
|
|
|
|
||||||||||||||||||||||
|
|
|
|
Cauca Valley
dry forests |
77 |
Colombia |
5,130 |
1 |
4 |
III |
|||||||||||||||||||
|
|
|
|
Magdalena
Valley dry forests |
78 |
Colombia |
13,837 |
1 |
4 |
III |
|||||||||||||||||||
|
|
|
|
Patía Valley
dry forests |
79 |
Colombia |
1,291 |
1 |
4 |
III |
|||||||||||||||||||
|
|
|
|
Sinú Valley dry
forests |
80 |
Colombia |
55,473 |
1 |
4 |
III |
|||||||||||||||||||
|
|
|
|
Ecuadorian dry
forests |
81 |
Ecuador |
22,271 |
1 |
1 |
I |
|||||||||||||||||||
|
|
|
|
Tumbes/Piura
dry forests |
82 |
Ecuador, Peru |
64,588 |
2 |
1 |
I |
|||||||||||||||||||
|
|
|
|
Marañon dry
forests |
83 |
Peru |
14,921 |
2 |
3 |
II |
|||||||||||||||||||
|
|
|
|
Maracaibo dry
forests |
84 |
Venezuela |
31,471 |
2 |
4 |
III |
|||||||||||||||||||
|
|
|
|
Lara/Falcón dry
forests |
85 |
Venezuela |
16,178 |
2 |
4 |
III |
|||||||||||||||||||
|
|
|
Central Andean Tropical
Dry Forests |
|
|
|
|
||||||||||||||||||||||
|
|
|
|
Bolivian
montane dry forests |
86 |
Bolivia |
39,368 |
1 |
3 |
II |
|||||||||||||||||||
|
CONIFER/TEMPERATE
BROADLEAF FORESTS |
|
|
||||||||||||||||||||||||||
|
|
Temperate
Forests |
|
||||||||||||||||||||||||||
|
|
|
Southern South
American Temperate Forests |
|
|
|
|
||||||||||||||||||||||
|
|
|
|
Chilean
winter-rain forests |
87 |
Chile |
24,937 |
2 |
2 |
I |
|||||||||||||||||||
|
|
|
|
Valdivian
temperate forests |
88 |
Chile,
Argentina |
166,248 |
3 |
1 |
I |
|||||||||||||||||||
|
|
|
|
Subpollar Nothofagus
forests |
89 |
Chile,
Argentina |
141,120 |
3 |
3 |
III |
|||||||||||||||||||
|
|
Tropical and
Subtropical Coniferous Forests |
|
|
|
||||||||||||||||||||||||
|
|
|
Eastern South
American Tropical and Subtropical Coniferous Forests |
||||||||||||||||||||||||||
|
|
|
|
Brazilian Araucaria
forests |
105 |
Brazil,
Argentina |
206,459 |
1 |
3 |
II |
|||||||||||||||||||
|
GRASSLANDS/SAVANNAS/SHRUBLANDS |
|
|||||||||||||||||||||||||||
|
|
Grasslands,
Savannas and Shrublands |
|
|
|
||||||||||||||||||||||||
|
|
|
Orinoco
Grasslands, Savannas and Shrublands |
|
|||||||||||||||||||||||||
|
|
|
|
Llanos |
110 |
Venezuela,
Colombia |
355,112 |
4 |
3 |
III |
|||||||||||||||||||
|
|
|
Amazonian
Grasslands, Savannas and Shrublands |
|
|||||||||||||||||||||||||
|
|
|
|
Guianan
savannas |
111 |
Suriname,
Guyana, Brazil, Venezuela |
128,375 |
4 |
3 |
III |
|||||||||||||||||||
|
|
|
|
Amazonian
savannas |
112 |
Brazil,
Colombia, Venezuela |
120,124 |
4 |
3 |
III |
|||||||||||||||||||
|
|
|
|
Beni savannas |
113 |
Bolivia |
165,445 |
2 |
3 |
II |
|||||||||||||||||||
|
|
|
Eastern South
American Grasslands, Savannas and Shrublands |
|
|||||||||||||||||||||||||
|
|
|
|
Cerrado |
114 |
Brazil,
Paraguay, Bolivia |
1,982,249 |
3 |
1 |
I |
|||||||||||||||||||
|
|
|
|
Chaco savannas |
115 |
Argentina,
Paraguay, Bolivia, Brazil |
611,053 |
3 |
2 |
I |
|||||||||||||||||||
|
|
|
|
Humid Chaco |
116 |
Argentina,
Paraguay, Uruguay, Brazil |
474,340 |
3 |
4 |
IV |
|||||||||||||||||||
|
|
|
|
Córdoba montane
savannas |
117 |
Argentina |
55,798 |
3 |
4 |
IV |
|||||||||||||||||||
|
|
|
Southern South
American Grasslands, Savannas and Shrublands |
|
|||||||||||||||||||||||||
|
|
|
|
Argentine Monte |
118 |
Argentina |
197,710 |
4 |
3 |
III |
|||||||||||||||||||
|
|
|
|
Argentine
Espinal |
119 |
Argentina |
207,054 |
4 |
3 |
III |
|||||||||||||||||||
|
|
|
|
Pampas |
120 |
Argentina |
426,577 |
2 |
3 |
III |
|||||||||||||||||||
|
|
|
|
Uruguayan
savannas |
121 |
Uruguay,
Brazil, Argentina |
336,846 |
3 |
3 |
III |
|||||||||||||||||||
|
|
Flooded
Grasslands |
|
|
|||||||||||||||||||||||||
|
|
|
Orinoco Flooded
Grasslands |
|
|||||||||||||||||||||||||
|
|
|
|
Orinoco
wetlands |
128 |
Venezuela |
6,403 |
4 |
3 |
III |
|||||||||||||||||||
|
|
|
Amazonian
Flooded Grasslands |
|
|||||||||||||||||||||||||
|
|
|
|
Western
Amazonian flooded grasslands |
129 |
Peru, Bolivia, |
10,111 |
4 |
3 |
III |
|||||||||||||||||||
|
|
|
|
Eastern
Amazonian flooded grasslands |
130 |
Brazil |
69,533 |
3 |
3 |
III |
|||||||||||||||||||
|
|
|
|
São Luis
flooded grasslands |
131 |
Brazil |
1,681 |
2 |
4 |
III |
|||||||||||||||||||
|
|
|
Northern Andean
Flooded Graslands |
|
|
||||||||||||||||||||||||
|
|
|
|
Guayaquil
flooded grassland |
132 |
Ecuador |
3,617 |
2 |
3 |
II |
|||||||||||||||||||
|
|
|
Eastern South
American Flooded Grasslands |
|
|
||||||||||||||||||||||||
|
|
|
|
Pantanal |
133 |
Brazil,
Bolivia, Paraguay |
140,927 |
3 |
1 |
I |
|||||||||||||||||||
|
|
|
|
Paraná flooded
savannas |
134 |
Argentina |
36,452 |
2 |
3 |
II |
|||||||||||||||||||
|
|
Montane
Grasslands |
|
||||||||||||||||||||||||||
|
|
|
Northen Andean
Montane Grasslands |
|
|
||||||||||||||||||||||||
|
|
|
|
Santa Marta
paramo |
137 |
Colombia |
1,329 |
3 |
1 |
I |
|||||||||||||||||||
|
|
|
|
Cordillera de
Mérida paramo |
138 |
Venezuela |
3,518 |
4 |
1 |
I |
|||||||||||||||||||
|
|
|
|
Northern Andean
paramo |
139 |
Ecuador |
58,806 |
3 |
1 |
I |
|||||||||||||||||||
|
|
|
Central Andean
Montane Grasslands |
|
|
||||||||||||||||||||||||
|
|
|
|
Cordillera Central
paramo |
140 |
Peru, Ecuador |
14,128 |
3 |
1 |
I |
|||||||||||||||||||
|
|
|
|
Central Andean
puna |
141 |
Bolivia,
Argentina, Peru, Chile |
183,868 |
3 |
2 |
I |
|||||||||||||||||||
|
|
|
|
Central Andean wet
puna |
142 |
Chile |
188,911 |
3 |
2 |
I |
|||||||||||||||||||
|
|
|
|
Central Andean
dry puna |
143 |
Argentina,
Bolivia, Chile |
232,958 |
3 |
2 |
I |
|||||||||||||||||||
|
|
|
Southern South American
Montane Grasslands |
|
|
||||||||||||||||||||||||
|
|
|
|
Southern Andean
steppe |
144 |
Argentina,
Chile |
198,643 |
4 |
4 |
IV |
|||||||||||||||||||
|
|
|
|
Patagonian
steppe |
145 |
Argentina,
Chile |
474,757 |
3 |
2 |
I |
|||||||||||||||||||
|
|
|
|
Patagonian
grasslands |
146 |
Argentina,
Chile |
59,585 |
3 |
3 |
III |
|||||||||||||||||||
|
XERIC
FORMATIONS |
|
|
||||||||||||||||||||||||||
|
|
Mediterranean
Scrub |
|
||||||||||||||||||||||||||
|
|
|
Central Andean
Mediteranean Scrub |
|
|
||||||||||||||||||||||||
|
|
|
|
Chilean
matorral |
148 |
Chile |
141,643 |
2 |
1 |
I |
|||||||||||||||||||
|
|
Deserts and Xeric
Shrublands |
|
||||||||||||||||||||||||||
|
|
|
Orinoco Deserts
and Xeric Shrublans |
|
|
||||||||||||||||||||||||
|
|
|
|
La Costa xeric
Shrublands |
168 |
Venezuela |
64,379 |
2 |
4 |
III |
|||||||||||||||||||
|
|
|
|
Arayua and
Paría xeric scrub |
169 |
Venezuela |
5,424 |
2 |
3 |
II |
|||||||||||||||||||
|
|
|
Northern Andean
Deserts and Xeric Shrublands |
|
|
||||||||||||||||||||||||
|
|
|
|
Galapagos
Islands xeric scrub |
170 |
Ecuador |
9,122 |
3 |
1 |
1 |
|||||||||||||||||||
|
|
|
|
Guajira/Barranquilla
xeric scrub |
171 |
Colombia,
Venezuela |
32,404 |
2 |
3 |
II |
|||||||||||||||||||
|
|
|
|
Paraguaná xeric
scrub |
172 |
Venezuela |
15,987 |
2 |
3 |
II |
|||||||||||||||||||
|
|
|
Central Andean
Deserts and Xeric Shrublands |
|
|
||||||||||||||||||||||||
|
|
|
|
Sechura desert |
173 |
Peru, Chile |
189,928 |
3 |
3 |
III |
|||||||||||||||||||
|
|
|
|
Atacama desert |
174 |
Chile |
103,841 |
3 |
3 |
III |
|||||||||||||||||||
|
|
|
Eastern South
American Deserts and Xeric Shrublands |
|
|
||||||||||||||||||||||||
|
|
|
|
Caatinga |
175 |
Brazil |
752,606 |
3 |
3 |
III |
|||||||||||||||||||
|
|
Restingas |
|
||||||||||||||||||||||||||
|
|
|
Northern Andean
Restingas |
|
|
||||||||||||||||||||||||
|
|
|
|
Paranaguá restingas |
176 |
Venezuela |
15,987 |
2 |
3 |
II |
|||||||||||||||||||
|
|
|
Amazonian
Restingas |
|
|
||||||||||||||||||||||||
|
|
|
|
Northeastern
Brazil restingas |
177 |
Brazil |
10,248 |
1 |
1 |
I |
|||||||||||||||||||
|
|
|
Eastern South
American Restingas |
|
|
||||||||||||||||||||||||
|
|
|
|
Brazilian Atlantic Coast restinga |
178 |
Brazil |
8,740 |
1 |
1 |
I |
|||||||||||||||||||
|
|
|
|
|
|||||||||||||||||||||||||
|
Data source: Dinerstein et al. (1995) |
|
|||||||||||||||||||||||||||
|
|
|
|||||||||||||||||||||||||||
|
Conservation status
codes: 1=critical, 2=endangered, 3=vulnerable, 4=relatively stable,
5=relatively intact |
|
|||||||||||||||||||||||||||
|
|
|
|||||||||||||||||||||||||||
|
Biological distinctiveness
codes: 1=globally outstanding, 2=regionally outstanding, 3=bioregionally
outstanding, 4=locally important |
|
|||||||||||||||||||||||||||
|
|
|
|||||||||||||||||||||||||||
|
Biodiversity priority
codes: I=highest priority at regional scale, II=high priority at regional
scale, III=moderate priority at regional scale, IV=important at national
scale |
|
|||||||||||||||||||||||||||
|
Table II: Area of Tropical Forest Present
in 1990 (km2)(a) |
||||||||
|
|
|
|
|
|
|
|
|
|
|
|
|
Tropical rain forests |
Moist decid- uous forest |
Dry decid- uous forest(b) |
Very dry forest |
Desert |
Hill and montane forest |
All forests(b) |
|
Bolivia |
|
0 |
355,820 |
73,460 |
0 |
40 |
63,850 |
493,170 |
|
Brazil |
|
2,915,970 |
1,970,820 |
288,630 |
0 |
0 |
435,650 |
5,611,070 |
|
Colombia |
|
474,550 |
41,010 |
180 |
0 |
0 |
24,900 |
540,640 |
|
Ecuador |
|
71,500 |
16,690 |
440 |
0 |
0 |
31,000 |
119,620 |
|
French Guiana |
79,930 |
30 |
0 |
0 |
0 |
0 |
79,970 |
|
|
Guyana |
|
133,370 |
31,670 |
0 |
0 |
0 |
19,120 |
184,160 |
|
Paraguay |
|
0 |
60,370 |
67,940 |
0 |
0 |
270 |
128,590 |
|
Peru |
|
403,580 |
122,990 |
190 |
2,690 |
1,840 |
147,770 |
679,060 |
|
Suriname |
|
114,400 |
33,280 |
0 |
0 |
0 |
0 |
147,680 |
|
Venezuela |
196,020 |
154,650 |
2,220 |
1 |
0 |
103,900 |
456,910 |
|
|
|
|
|
|
|
|
|
|
|
|
Total |
|
4,389,320 |
2,787,330 |
433,060 |
2,691 |
1,880 |
826,460 |
8,440,870 |
|
|
|
|
|
|
|
|
|
|
|
(a) Data source: FAO (1993). |
||||||||
|
(b)
Includes cerrado, caatinga and chaco. |
||||||||
|
Table III: Land-Cover in
South America in 1988 |
|
|
|
|
|
|||||||||
|
|
|
|
|
|
|
|
|
|
|
|
|
|
|
|
|
|
Closed |
|
|
|
|
|
|
Degraded |
Scrub |
|
|
|
|
|
|
|
Tropical |
Recently |
|
Degraded |
|
Degraded |
Savanna, |
Savanna, |
lands, |
Desert, |
|
Snow, |
|
|
|
|
Moist |
Degraded |
Closed |
Closed |
Wood- |
Wood- |
Grass- |
Grass- |
Shrub- |
Bare |
|
Rock, |
|
|
|
|
Forest |
TMF |
Forest |
Forest |
lands |
lands |
lands |
lands |
lands |
Soil |
Water |
Ice |
Other |
Total |
|
|
|
|
|
|
|
|
|
|
|
|
|
|
|
|
|
Argentina |
1.2 |
0.0 |
96.8 |
0.6 |
645.4 |
15.7 |
755.4 |
232.8 |
894.a |
37.9 |
34.0 |
31.4 |
35.7 |
2,779.8 |
|
Bolivia |
323.5 |
12,7 |
409.2 |
24.6 |
345.1 |
102.2 |
87.7 |
86.2 |
4.8 |
16.5 |
11.9 |
0.1 |
1.1 |
1,089.4 |
|
Brazil |
3,522.3 |
519.7 |
3,686.0 |
1,692.2 |
1,555.9 |
330.0 |
740.0 |
179.4 |
0.0 |
0.0 |
80.9 |
0.0 |
124.0 |
8,388.5 |
|
Chile |
0.0 |
0.0 |
134.1 |
29.1 |
75.2 |
29.8 |
101.1 |
14.0 |
86.9 |
186.8 |
7.0 |
16.6 |
3.8 |
684.5 |
|
Colombia |
581.6 |
5.4 |
622.5 |
11.4 |
116.3 |
14.5 |
255.5 |
64.0 |
0.0 |
0.0 |
3.1 |
0.0 |
22.8 |
1,110.1 |
|
Ecuador |
115.5 |
1.7 |
121.0 |
1.7 |
33.7 |
4.3 |
41.9 |
13.3 |
3.2 |
2.5 |
0.6 |
0.0 |
0.8 |
223.1 |
|
French Guiana |
78.8 |
0.0 |
79.8 |
2.4 |
0.6 |
0.0 |
0.2 |
0.0 |
0.0 |
0.0 |
0.1 |
0.0 |
1.0 |
84.1 |
|
Guyana |
159.4 |
2.0 |
171.6 |
2.4 |
5.4 |
0.3 |
18.4 |
1.5 |
0.0 |
0.0 |
1.2 |
0.0 |
3.7 |
204.3 |
|
Paraguay |
0.3 |
0.0 |
8.9 |
0.2 |
209.1 |
50.7 |
104.0 |
26.5 |
0.0 |
0.0 |
0.6 |
0.0 |
1.1 |
401.1 |
|
Peru |
620.8 |
19.1 |
654.7 |
19.1 |
88.0 |
78.8 |
139.0 |
97.4 |
64.3 |
88.0 |
8.3 |
0.7 |
5.6 |
1,244.1 |
|
Suriname |
126.0 |
2.5 |
128.5 |
10.0 |
0.5 |
0.3 |
1.2 |
0.4 |
0.0 |
0.0 |
1.1 |
0.0 |
3.3 |
145.2 |
|
Uruguay |
1.4 |
0.0 |
2.1 |
0.0 |
0.9 |
0.0 |
154.1 |
11.0 |
0.0 |
0.0 |
3.0 |
0.0 |
5.9 |
177.0 |
|
Venezuela |
379.1 |
0.2 |
415.5 |
9.9 |
33.9 |
40.2 |
243.3 |
82.0 |
27.2 |
0.0 |
11.4 |
0.0 |
8.4 |
871.8 |
|
Unclassified |
|
|
|
|
|
|
|
|
|
|
|
|
|
313.0 |
|
Total |
5,909.9 |
563.4 |
6,530.7 |
1,803.7 |
3,109.8 |
666.9 |
2,642.0 |
808.5 |
1,080.6 |
331.7 |
163.2 |
48.9 |
2t7.2 |
17,716.1 |
|
|
|
|
|
|
|
|
|
|
|
|
|
|
|
|
|
Continent |
33.4% |
3..2% |
36.9% |
10.2% |
17.6% |
3.8% |
14.9% |
4.6% |
6.1% |
1.9% |
0.9% |
0.3% |
1.2% |
100.0% |
|
Category |
|
8.7% |
|
21.6% |
|
17.7% |
|
23.4% |
|
|
|
|
|
|
N.B. All values in thousands
of km2 or percent.
"TMF" includes Tropical
Moist, Semi-deciduous and Gallery Forests
"Grasslands"
includes those seasonally flooded
"Closed forest"
includes TMF, Montane forests, Cool and Temperate Deciduous Forests and
Tropical Seasonal Forests "Degraded grasslands" includes Agriculture
"Desert, Bare Soil" includes inland Salt Marsh Communities
"Other" includes
wet vegetation and mangroves
Source: Stone et al., 1994.
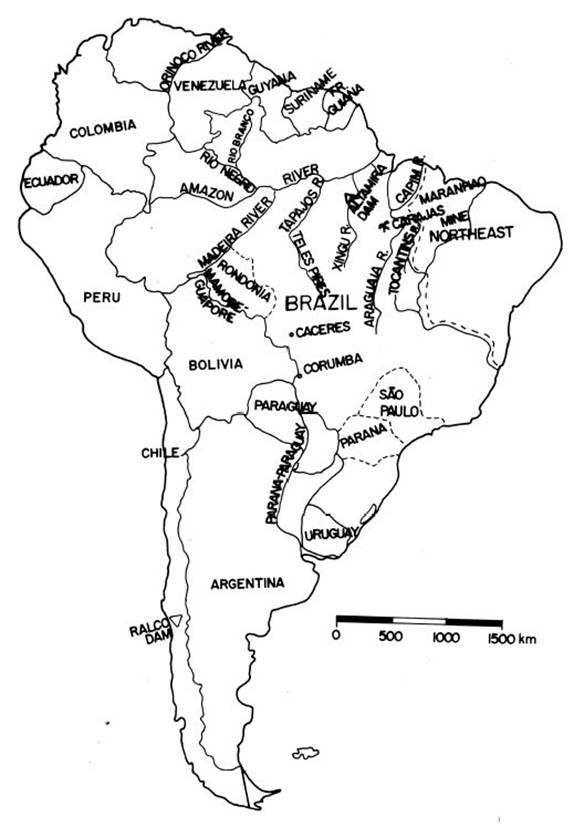
Fig. 1 part
1
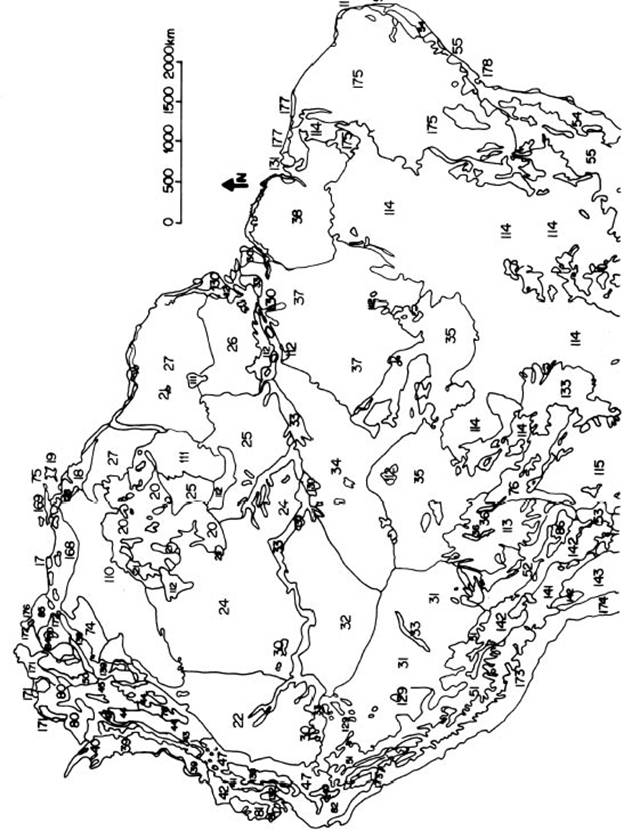
Fig. 1 part
2
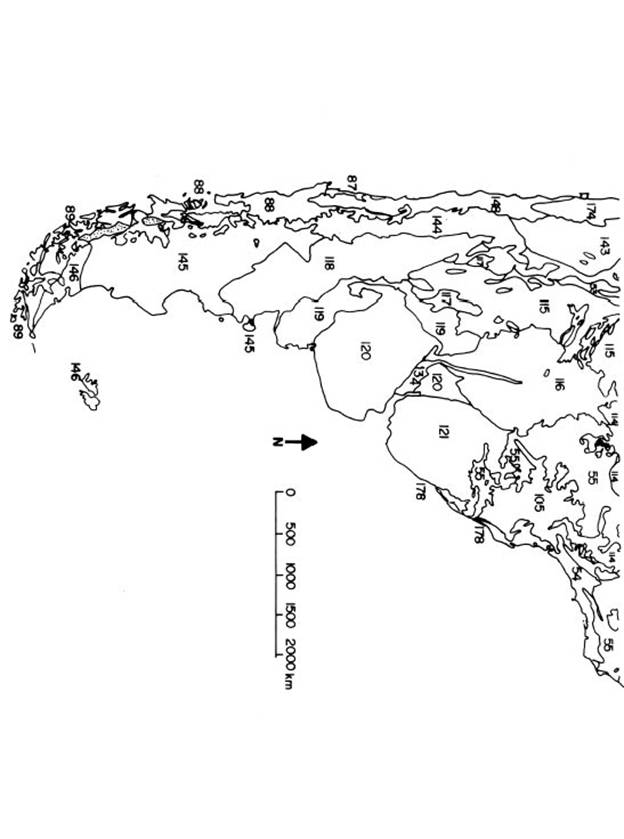
Fig. 2