Fig. 1
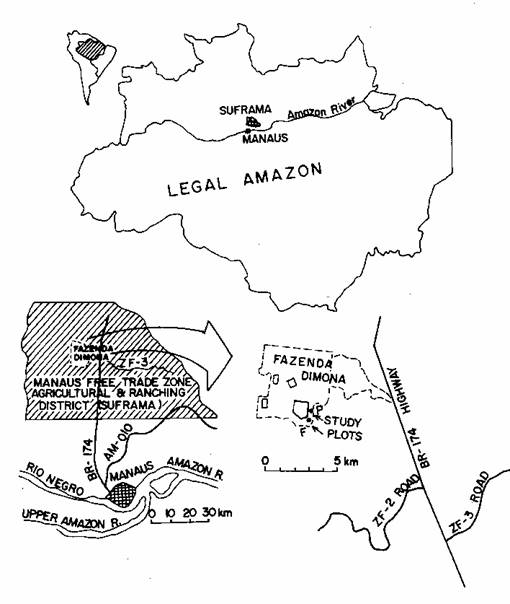
Fig. 2
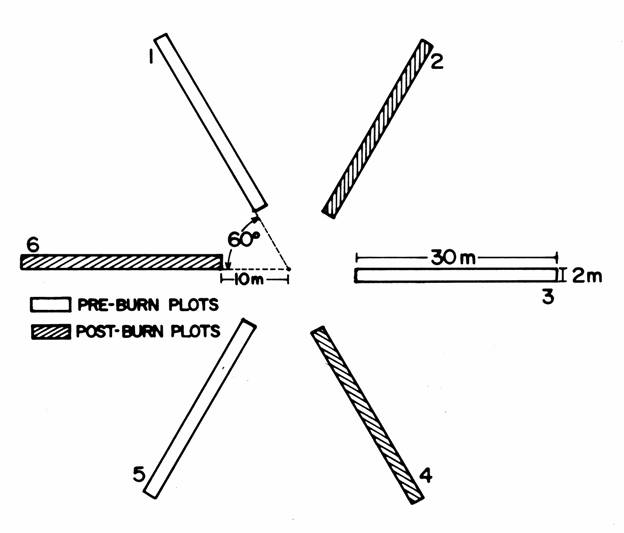
Fig. 3
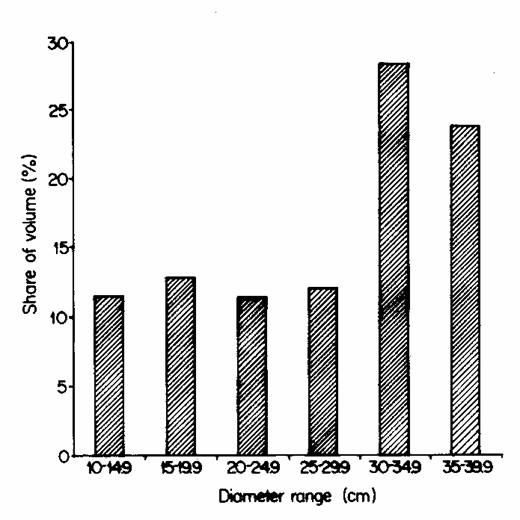
Fig. 4
Fig. 5
The
text that follows is a PREPRINT.
Please cite as:
ISSN:
0378-1127
Copyright:
Elsevier
The original publication is available at: http://www.elsevier.com.nl
BURNING OF AMAZONIAN RAINFORESTS: BURNING EFFICIENCY AND CHARCOAL
FORMATION IN FOREST CLEARED FOR CATTLE PASTURE NEAR MANAUS, BRAZIL
Philip M. Fearnside
Paulo
Maurício Lima de Alencastro Graça
Fernando
José Alves Rodrigues
Department
of Ecology
National Institute for
Research
in the Amazon (INPA)
Caixa Postal 478
69011-970
Manaus, Amazonas
BRAZIL
Email:
pmfearn@inpa.gov.br
Fax: +55-92–642-8909
23 Nov. 1999
27 Mar. 2000
For: Forest Ecology
and Management
TABLE OF CONTENTS
Abstract
...................................................
Key words ..................................................
1. Introduction
............................................
2. Methods
.................................................
3. Results
3.1.
Biomass stocks ...................................
3.2. Influence of slope on stock of wood >10 cm in diameter
.......................................
3.3.
Comparison between the direct and LIS methods ....
3.4.
Charcoal formation ...............................
3.5.
Stock of carbon in the biomass ...................
3.6.
Burning efficiency and biomass consumption .......
4. Discussion
..............................................
5. Conclusions
.............................................
Acknowledgments
............................................
References
.................................................
Figure captions
............................................
Abstract
Twelve 60-m2 plots were cut and
weighed in a clearing at a cattle ranch near Manaus, Amazonas, Brazil. Above-ground dry weight biomass averaged 369
metric tons (megagrams = Mg) per hectare (Mg ha-1) (SD=187). This corresponds to approximately 483 Mg ha-1
total biomass. Pre- and post-burn
above-ground biomass loading was evaluated by cutting and weighing, and by
line-intersect sampling (LIS) done along the axis of each quadrat. Because direct weighing of biomass disturbs
the material being measured, the same quadrats cannot be weighed both before
and after the burn. The high variability
of the initial biomass present in the quadrats made use of volume data from the
LIS more reliable for assessing change in the biomass of wood >10 cm in
diameter; estimates of changes in other biomass components relied on data from
direct weighing. Estimates of initial
stocks of all components relied on direct measurements from the pre-burn
quadrats; in the case of wood >10 cm in diameter this was supplemented with
direct measurements from the post-burn quadrats adjusted for losses to burning
as determined by LIS. The measurements
in the present study imply a 28.3% reduction of above-ground carbon pools. This estimate of burning efficiency is in the
same range obtained in other studies using the same method, but two other
methods in use in Brazilian Amazonia produce consistently different results,
one higher and the other lower than this one.
Charcoal made up 1.7% of the dry weight of our remains in the post-burn
destructive quadrats and 0.93% of the volume in the line-intersect sampling
transects. Approximately 1.8% of the
pre-burn above-ground carbon stock was converted to charcoal.
Key words: Deforestation, Burning, Greenhouse
gases, Carbon dioxide, Tropical Forest, Biomass, Rainforest
1. Introduction
Deforestation
in Brazilian Amazonia is a significant contributor to global emissions of
greenhouse gases (GHGs). Among the
sources of GHG emissions, biomass burning is one for which calculations have
the least foundation in field measurements.
Previous measurements have been made of burning efficiency (Araújo et
al., 1999; Carvalho, Jr. et al., 1995, 1998; Fearnside et al., 1993, 1999;
Graça et al., 1999; Guild et al., 1998; Kauffman et al., 1995), and charcoal
formation in burns of mature forest in Brazilian Amazonia (Fearnside et al.,
1993, 1999; Graça et al., 1999).
Although the number of measurements is still woefully small, the
increase in available information allows estimation of the relationship between
fuel dimensions and burning efficiency (the percentage of carbon released from
the initial stock of carbon contained in the pre-burn above-ground
biomass). Among other reasons for
quantifying this relationship is its necessity in accounting for changes
expected as a consequence of logging the forest prior to deforestation.
A
wide variety of estimates exists for the magnitude of the contribution of
tropical deforestation to global warming.
The strength of the empirical basis for the estimates is even more
varied. It is still common for the most
rudimentary "back-of-the-envelope" calculations to play prominent
roles in the policy debate surrounding global warming. Burning efficiency and charcoal formation are
important factors in determining GHG emissions.
These factors control how much release occurs through combustion and how
much through decay—an important difference if one is estimating quantities of
trace gases rather than simply carbon.
The
present study was carried out in an area being cleared for cattle pasture in
the Manaus Free Trade Zone's Agriculture and Ranching District, in the state of
Amazonas (Fig. 1). Fazenda Dimona, a
10,000-ha ranch, was the site of the study; this is one of the four ranches
where the National Institute for Research in the Amazon (INPA)/Smithsonian
Institution (formerly INPA/World Wildlife Fund-US) Biological Dynamics of
Forest Fragments Project is conducting a long-term study of changes in isolated
reserves remaining as islands surrounded by pasture (Laurance and Bierregaard,
Jr., 1997; Lovejoy and Bierregaard, Jr., 1990).
Average annual rainfall at INPA's Model Basin, 14 km south of Fazenda
Dimona, is 2052 mm (estimated from monthly means: Nov. 1979-Aug. 1984), but
inter-annual variability is high. The
clearing at Fazenda Dimona is at 2o19'24"S, 60o5'42"W,
or about 1.6 km east of the 1984 clearing in which an earlier study of biomass
and burning was conducted (Fearnside et al., 1993). Forest at the site is classified as Db (dense
closed Amazonian lowland forest) in the vegetation typology used by the
Brazilian Institute of the Environment and Renewable Natural Resources (IBAMA)
(Brazil, IBGE and IBDF, 1988), and as Fda (tropical dense forest of the
sub-region of low plateaus of Amazonia, lowlands with dissected topography) in
the RADAMBRASIL typology (Brazil, Projeto RADAMBRASIL, 1978).
[Figure
1 here]
The
Biological Dynamics of Forest Fragments project in which the study plots are
located has an extraordinarily large data set on tree diameters and associated
forest biomass. Over 137,000 diameter at
breast height (DBH) measurements have been made on > 56,000 trees with
DBH ≥ 10 cm; all of these trees have been mapped, botanically collected
and identified to family, and most have been identified to species. In 65 1-ha plots in standing forest, the
above-ground live biomass (including a correction for trees < 10 cm DBH) is
355.8±47.0 Mg ha-1 (Laurance et al., 1999), while for the subset of
36 plots located at least 100 m from the nearest forest edge it is 381.5±38.5
Mg ha-1 (Laurance et al., 1997).
The area was quite inaccessible prior to the mid-1970s (with the
exception of the historical occupation by indigenous peoples that applies to
all Amazonian forests) and can be considered “primary” forest.
The
study was done in a 17-ha clearing made for cattle pasture at Fazenda
Dimona. The clearing is in an L-shaped
strip along the southern and eastern sides of a 100-ha reserve (No. 2303). The felling was carried out by the Biological
Dynamics of Forest Fragments project in order to isolate the reserve, and was
done in early August 1990. The forest
clearing was done using methods typical of Amazonian deforestation in general,
beginning with underclearing (broca) using a brush hook (foice),
followed by felling large trees using chainsaws (see Fearnside, 1990). Plots were set out after the felling was
completed and the trees were lying on the ground. After being allowed to dry, the vegetation
was burned on 19 September 1990.
Estimates
of Amazon forest biomass vary tremendously.
Because of the high biomass and vast area of dense upland forests in
Amazonia, differences in values used for their biomass have a great effect on
the conclusions drawn from calculations of release of carbon dioxide (CO2)
and other greenhouse gases. These
controversies are reviewed elsewhere (Fearnside et al., 1993; Fearnside, 1994).
2. Methods
The
great spatial heterogeneity in the fallen trunks makes burning efficiency
determination impractical for large-diameter biomass components without very
large sample sizes if efficiency is estimated by comparing destructive
measurements (necessarily at different points) before and after the burn. The solution has been to base burning
efficiency for this biomass component on indirect (LIS) measurements made on
the same pieces of wood, measured before and after the burn at the same marked
points. The burning efficiency estimate
for the above-ground biomass as a whole is therefore derived from a combination
of direct and indirect results.
Two
"stars" of destructive quadrats were implanted, each consisting of
six rays or quadrats of 2 × 30 m (Fig. 2).
Locations of the stars within the clearing were chosen by generating the
coordinates of the central point as random numbers, and extending the rays from
the central point in pre-determined directions.
Half of the quadrats in each star were harvested before the burn, and
half after. The pre- and post-burn rays
alternate, so as to avoid any bias from the non-random spatial orientation of
the felled trees (for ease in felling, chainsaw operators try to cut trees so
that they fall roughly in parallel). The
method is described in greater detail elsewhere (Fearnside et al., 1999; Graça
et al., 1999). In each quadrat, a
line-intersect sampling (LIS) transect was run along the midline of the
quadrat, with measurements made for pieces >10 cm in diameter (Warren and
Olsen, 1964). Diameters were measured at
right angles to the axis of each piece (Van Wagner, 1968). Numbered aluminum tags were nailed to each
piece at the point of measurement, allowing re-measurement in the same place
and identification of the piece.
Diameters were measured perpendicular to the axis of each piece--not
following the transect line. We
emphasize that these diameter measurements are not diameters at breast height
(i.e., diameter at 1.3 m above the ground on a standing tree); the random
location of the points at which the transect lines cross the prostrate trunks
and branches of felled trees allows calculation of wood volume directly from
the cross-sectional area of the intersection points, without use of allometric
equations or form factors.
[Figure
2 here]
Within
each quadrat, all biomass above ground level was cut with chainsaws, axes and
machetes, and weighed using a series of spring balances, the largest being of
90-kg capacity accurate to ±1 kg. In the
pre-burn quadrats, biomass was divided into ten fractions (pools): wood with
diameter <5 cm, 5-10 cm and >10 cm; vines with diameter <5 cm, 5-10 cm
and >10 cm; litter (including leaves that fall off the trees after felling);
palms with diameter ≤10 cm and >10 cm; and "other" (bamboo
and other grasses, palm fruits, etc.).
The same pools were evaluated post-burn, plus additional categories for
charcoal on the ground and charcoal still attached to unburned biomass. Subsamples of each fraction were collected in
each quadrat for determination of water content for calculating dry weights.
Charcoal
on the ground was collected manually from the entire area of the post-burn
plots. Charcoal adhering to the biomass
was scraped off with machetes. The same
procedures used in the previous studies were applied (see Fearnside et al.,
1993, 1999 for additional details of the collection procedure). The present charcoal production estimate
excludes very finely powdered charcoal that cannot be collected manually from
the ground and particulate elemental carbon released as soot in smoke.
Samples
were dried in electric ovens to constant weight at 105oC. Subsamples were weighed at intervals to
determine when constant weight had been attained.
Charcoal
thickness was measured at four points equally spaced around the circumference
of each piece: top, bottom, and two sides; in cases where a trunk was lying on
the ground, the "bottom" measurement was made on one side as closely
as possible to ground level, following the procedures applied previously
(Fearnside et al., 1999).
The
initial (pre-burn) biomass present in the area is estimated from the direct
measurements of all components in the pre-burn quadrats. The great spatial heterogeneity of the wood
>10 cm in diameter, however, makes it advisable to extend the sample size as
much as possible for this biomass component.
The sample size is doubled by using the volume of wood >10 cm in
diameter present before the burn in the post-burn plots, as determined by
LIS. The areas sampled for initial biomass
are therefore 720 m2 for wood >10 cm in diameter, and 360 m2
for other biomass components.
3. Results
3.1. Biomass stocks
Pre-burn
biomass of wood and palms >10 cm in diameter was estimated from all plots,
with adjustments to LIS measurements in post-burn plots as described above,
while other components were estimated from direct measurements in pre-burn
plots (Table 1). The mean total
above-ground biomass dry weight was 369±187 megagrams
(Mg) (= metric tons) ha-1 before the burn. The class of wood >10 cm in diameter
totaled 270±121 Mg ha-1 and
represented the greatest portion of the above-ground stock (73.1%). The fractions of wood <5 cm and wood 5-10
cm in diameter (composed mostly of branches) together totaled 55±32 Mg ha-1
and represented 14.9% of the total stock of above-ground biomass; vines totaled
11±19 Mg ha-1 and represented 2.9%; palms contributed 3.5 Mg ha-1
and represented 0.9%; litter (including leaves and twigs that had fallen off
the trees after felling) contributed 30±13 Mg ha-1 and represented
8.1%.
[Table
1 here]
Total
biomass remaining above ground after the burn was 258±134 Mg ha-1
(Table 2). The biomass of wood >10 cm
in diameter was 223±99 Mg ha-1 and represented 86.4% of the total
remaining biomass above ground. The
fractions for wood <5 cm and wood 5-10 cm in diameter (composed mostly of
branches) together totaled 18±16 Mg ha-1, representing 7.0% of the
total stock of biomass above ground; vines totaled 1.7±3.6 Mg ha-1
and represented 0.7%; palms contributed 1.7 Mg ha-1 and represented
0.7%; litter (including leaves and twigs falling off trees after felling)
contributed 9.6±9.1 Mg ha-1 and represented 3.7%, and charcoal
contributed 4.3±5.9 Mg ha-1 and represented 1.7%.
[Table
2 here]
Above-ground
biomass before and after burning for each fraction are shown in Table 2. The size of the pieces greatly influences the
percentage burned: 17.5% of the >10-cm diameter wood being burned versus
79.8% of the <5-cm diameter wood. Of
the above-ground biomass present before the burn, 8.3% was <5 cm, 6.6% 5-10
cm and 73.2% >10 cm in diameter. No significant difference was found between
results for biomass determination using the LIS and
the direct method for wood >10 cm in diameter (t-test, p=0.47; n=6).
Approximate
total dry weight biomass can be estimated using the fraction of the total
biomass in roots found in existing studies that include below-ground
biomass. Using a root/shoot ratio of
0.31 (derived from three studies reviewed in Fearnside, 1994) as the estimate
for below-ground biomass results in an estimate
of total dry weight biomass of 483 Mg ha-1 at Fazenda Dimona. Average wood density for the >10 cm diameter class was 0.81 g cm-3
(oven-dry weight/volume at time of collection, n=18, SD=0.12).
3.2. Influence of slope on stock of wood >10 cm in diameter
By
chance one of the stars (P) was located on steeply sloping terrain, with almost
half (48%) of the total length of the rays having slopes ≥55%, with some
slopes up to 68%. The other star (F) was
on level ground. No significant
difference was found in the biomass of wood >10 cm
in diameter present in the two stars (p=0.81, n=6). The steep slope of the terrain at point
(star) P did not influence the result for pre-burn biomass in the class of wood
>10 cm in diameter when compared with point
F on flat land. The biomass contained in
the post-burn plots (rays) was converted to pre-burn biomass using the
percentage changes from the burn obtained from the LIS for these plots. The means for biomass of >10 cm in diameter in the two sets of plots were
not significantly different (t-test, p=0.812, n=6). The mean for biomass of wood >10 cm in diameter on flat terrain was 277±118 Mg
ha-1, while on the steeply sloping terrain it was 263±85 Mg ha-1.
3.3. Comparison between the direct and LIS
methods
The
values for mean biomass for wood >10 cm in
diameter after the burn derived by the two methods did not differ significantly
(t-test, p=0.474, n=6). The
post-burn mean biomass for wood >10 cm in
diameter by the direct method was 215±86 Mg ha-1 (Table 1), while
that estimated from LIS was 259±111 Mg ha-1.
3.4. Charcoal formation
The
total stock of charcoal formed after the burn as determined by the direct
method was 4.3±5.9 Mg ha-1.
Of this, 1.2±1.8 Mg ha-1 of charcoal was lying on the ground
and the remaining 3.1±4.1 Mg ha-1 was clinging to the above-ground
biomass. The class of wood >10 cm in diameter contributed 71.0% (2.2±2.7 Mg ha-1)
to the total of charcoal clinging to the biomass. Using the indirect method (LIS), the
estimated stock of charcoal clinging to the biomass for wood >10 cm in diameter was 1.5±0.7 Mg ha-1. The estimated mean charcoal stocks clinging
to the biomass for wood >10 cm in diameter
did not differ significantly between the direct and indirect methods (t-test, p=0.11,
n=6).
3.5. Stock of carbon in the biomass
Biomass
stocks were converted to carbon (Table 3) using the percentage of carbon in the
pre- and post-burn biomass from Fearnside et al. (1993). Carbon content of charcoal is assumed to be
74.8%--the mean for charcoal manufactured from primary forest woods in the
Manaus region (Corrêa, 1988, p. 99).
Carbon partitioning among different compartments is calculated in Table
3. Total stock of carbon in above-ground
biomass before the burn was 182 t C ha-1. After the burn the stock of carbon was
reduced to 130 t C ha-1, presumably releasing 51 Mg ha-1
of carbon into the atmosphere. Of the
carbon in pre-burn biomass, 1.8% is converted to charcoal. The means of pre- and post-burn biomass
measurements imply a release of 28.3% of the pre-burn carbon stock (Table 3).
[Table
3 here]
Although
we did not analyze carbon in the ashes from this study, we know that their
carbon content is very low based on other studies (C concentration = 6.6%, SE=0.5, n=6; see Graça et al., 1999). Ashes therefore can be expected to contribute
very little to the total stock of post-burn carbon.
3.6. Burning efficiency and biomass consumption
Overall
burning efficiency was 28.3% (Table 3). Biomass
fractions most consumed by the burn were vines >10
cm in diameter and vines <5 cm in
diameter, losing 92.0% and 86.7% of their weight, respectively. The class of wood >10 cm in diameter was
the one that burned least, with only 17.5% of its biomass being consumed by
fire.
Burning
efficiency and water content of wood, which accounts for 160 t C ha-1
of the 182 t C ha-1 total pre-burn carbon stock, or 87.9%, follows a
regular pattern. As diameter increases,
the percentage of water content at the time of the fire increases and the
burning efficiency decreases (Table 4).
One would expect that differences in the burning efficiency among
materials of the same dimensions would be explained by the intrinsic water content
of each type of plant tissue. Classes
with higher water contents should have lower burning efficiencies. However, we found that some fractions of the
less important types with higher pre-burn water contents were more completely
burned than others with lower water contents (Table 4). The class of wood <5 cm in diameter had a
79.8% burning efficiency and a mean water content of 30.3%, while vines in the
same diameter class had a burning efficiency of 86.7% and a water content of
71.8%. The high variability in the
sampling may explain this result for small fractions such as vines, which
represent only 2.4% of the pre-burn carbon stock. Categories of biomass with smaller amounts
present generally have greater variability (e.g. Table 2).
[Table
4 here]
4. Discussion
The
results show high variability in biomass over short distances. The small area of the study plots logically
results in high levels of variability.
In addition, variability between quadrats can be expected to be higher
for plots in an already felled forest, as in the present study, than for plots
in the same area with the forest still standing, as in studies where the
estimates are done from volume estimates of standing trees, or where felling is
done experimentally. For plots of equal
size, higher variability is expected in already felled areas because the
process of felling leads to greater clumping.
High
variability indicates a need for many measurements and careful sampling design
in order to gain adequate estimates of biomass for the region as a whole. Biomass studies in the general area of the
study site are compared in Table 5. All
of these studies are in the same forest type (Db) as classified by the
Brazilian Institute for Environment and Renewable Natural Resources (IBAMA)
(Brazil, IBDF and IBGE, 1988). The
largest data-set for the area immediately surrounding the study is based on
diameter measurements of trees ≥10 cm diameter at breast height (DBH) in
65 1-ha plots of standing forest (Laurance et al., 1999). When adjusted for vines and dead biomass,
this indicates a mean of 384 Mg ha-1 of above-ground biomass, quite
close to our value of 369 Mg ha-1.
For the same forest type throughout the state of Amazonas, the mean
above-ground biomass averages 332 Mg ha-1, based on forest volume
surveys conducted by Brazil's Projeto RADAMBRASIL (1978) in the same forest
type (Fearnside, 1994). Indirect methods
based on forest volumes are needed to obtain reliable means for large areas,
although estimates such as those in the present study are needed to adjust the
volume-based studies for other components such as vines and palms.
[Table
5 here]
The
relative contributions that different classes of material make to emissions
will determine how these results can be applied to other types of forests in
the region. Although the larger-diameter
classes represent the largest part of the pre-burn biomass, the small
proportion of these classes that burns reduces their relative importance in the
carbon emitted by combustion (Fig. 3).
The percentage of material in the >10 cm diameter class varies among
sites. The present study at Fazenda
Dimona found wood >10 cm in diameter to represent 73.2% of the pre-burn
above-ground biomass, which agrees well with the 76.1% we found in our previous
study on the same ranch (Fearnside et al., 1993). By contrast, wood >10 cm in diameter
represented 62.4% of the biomass at Fazenda Nova Vida (Ariquemes), Rondônia
(Graça et al., 1999) and 52.5% at Altamira, Pará (Fearnside et al., 1999). These latter sites had substantially more of
the emission contributed by the small-diameter classes, especially at Altamira
where vines were more abundant than at the other sites (Fig. 3).
[Fig.
3 here]
Within
the > 10-cm diameter wood class, the distribution of volume among diameter
ranges could affect the burning efficiency of this class. Were the biomass dominated by a few very
large individuals, the burning efficiency could be expected to be lower than if
trees of modest diameter make up most of the biomass. While some very large individuals occur in
the forest, our study plots did not contain any of these (the maximum diameter
was 38.0 cm). For the post-burn plots
(from which burning efficiency for the > 10-cm diameter wood class is
derived) the distribution of volume among diameter ranges for the pre-burn
measurements is shown in Figure 4.
[Fig.
4 here]
Our
estimate of burning efficiency at Fazenda Dimona (28.3%) is in the range of
other estimates obtained by this method (Method 1 in Table 6) in other primary
forest burns in Amazonia. Two other
methodologies have been used in the region, with results that appear to differ
from ours for methodological reasons.
One (Method 2 in Table 6) has generally produced higher values for
burning efficiency. This method used a
LIS similar to ours, with the important difference that only the two end points
of each transect were marked, not the point on each piece where the measurement
was made. Destructive sampling was not
used (except for litter, live seedlings and resprouts), instead estimating all
size classes using LIS, with shorter transects for the smaller-diameter
classes. The estimates of Kauffman et
al. (1995) each has a total transect length of 352 m for pieces ≥7.6 cm
in diameter, about the same as the total of 360 m in the present study but with
double the length for which we have both pre- and post-burn transects.
[Table
6 here]
The
third method (Method 3 in Table 6) has produced consistently lower values. This method used an observation (method,
sample size and variability not specified) that no more than 3 mm (Araújo et
al., 1999) or 5 mm (Carvalho, Jr. et al., 1995) was removed from the diameter
of each piece for trunks >5 cm and branches >10 cm in diameter. This reduction in diameter was then applied
to the volume of material in each of these categories, resulting in very low
burning efficiencies for these fractions.
In the most recent study (Carvalho, Jr. et al., 1998), the diameter
reduction was measured separately for each trunk or branch in the sample
quadrats, as well as the length along the piece to which the reduction
applied. This method indicates minimal
amounts of burning in biomass fractions for which burning efficiency was
estimated with this procedure: 0.4% for trunks of trees >30 cm diameter at
breast height (DBH), 4.4% for trunks of trees 5-30 cm DBH, and 4.4% for
branches >10 cm in diameter (Carvalho, Jr. et al., 1998). These values are at least an order of
magnitude lower than our results for material >10 cm in diameter (Table
4). On the other hand, burning efficiencies
for the remaining (smaller-diameter) fractions may be biased in the opposite
direction. These were estimated by
direct weighing of the same material before and after the burn, but cutting and
piling the material in bonfire-like heaps (see photographs in Araújo, 1995, pp.
186-189) probably led to over-estimates of the burning efficiencies for these
fractions.
It
should be emphasized that conclusions on the effect of methodology are
necessarily limited by the fact that burn quality varies greatly from one site
to the next and from one year to the next, depending on meteorological
parameters, timing of the burn, and characteristics of the vegetation
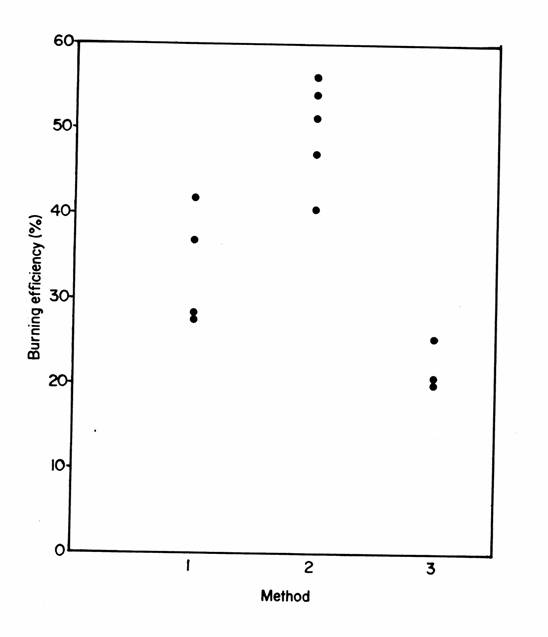
(Fearnside, 1986, 1989). Nevertheless,
the clustering of results obtained by different methods suggests a
methodological effect (Fig. 5). Our
method (Method 1 in Fig. 4) produces a mean value for percent burning
efficiency (x̅=33.7±6.9) significantly lower (p<0.001) than
Method 2 (x̅=49.8±6.2) and higher (p<0.05) than Method 3 (x̅=21.9±2.8).
[Figure
5 here]
Although
the explanation for differences in results associated with the different
methodologies remains unknown, we are confident that our LIS procedure’s
re-measurement of diameters at precisely marked locations on each piece greatly
reduces error in determination of burning efficiency for the >10-cm diameter
class that contributes most to carbon emissions (Fig. 3), thereby greatly
reducing the uncertainty of our overall result as compared to the other two
methods. Our direct-method estimates for
combustion efficiency of the smaller size categories, although highly variable
due to the natural heterogeneity of the fuel load and of the burning process,
have no known biases either up or down.
This probably makes them more reliable than direct methods that use
burning in disturbed material (i.e., Carvalho, Jr. et al., 1995, 1998) that
would have a high bias. On the other
hand, the LIS method applied by Kauffman et al. (1995) for material in this
size class may produce more reliable results for combustion efficiency of this
fraction than does our more labor-intensive direct weighing approach. A comparison of the two methods in the same
burn would be needed to determine which approach is most efficient for the
small-diameter portion of the material.
Our
percentage of charcoal formation (1.8% of pre-burn above-ground carbon) is in
the same range as those found in our other studies of primary forest burns:
1.3% at Altamira, Pará (Fearnside et al., 1999), 2.9% at Ariquemes, Rondônia
(Graça et al., 1999), and 2.7% at Fazenda Dimona, Amazonas (Fearnside et al.,
1993). The absolute amount of charcoal
dry weight formed in the burn studied here (4.3 Mg ha-1) is also
similar to that found in the above studies, which found, respectively, 2.2 Mg
ha-1 at Altamira, 6.4 Mg ha-1
at Ariquemes, and 4.7 Mg ha-1 at Fazenda Dimona. Globally, an estimated 49 × 106 t
C is converted to charcoal annually by biomass burning in tropical
deforestation and in clearing of secondary forests (including shifting
cultivation), considering clearing rates for the 1981-1990 period (Fearnside,
nd). This reduces annual net committed
emissions of 2.4 × 10⁹ t C by only 2% (Fearnside, nd). However, charcoal is important as one of the
only ways that carbon is transferred to long-term pools in black carbon and can
have important effects on atmospheric composition over geological time scales
(e.g. Kuhlbusch, 1998).
5. Conclusions
The
dense forests of Central Amazonia have high biomass, but spatial variability is
great. Burning efficiency (percent of
the pre-burn above-ground carbon stock released in the burn) depends strongly
on the diameter of the material, smaller-diameter pieces burning more
completely. While burning efficiency
varies among burns, knowledge of the size composition of the material allows a
substantial reduction of the uncertainty in predicting the amount of the total
above-ground biomass consumed in a burn.
The burning efficiency of 28.3% determined for the burn studied is in
the range of values found for other burns estimated using the same method, but
two other methods in use in Brazilian Amazonia have produced consistently
different results, one higher and one lower than those obtained with the method
used here. The study’s finding that 1.8%
of pre-burn above-ground carbon is converted to charcoal confirms low rates of
charcoal formation in Amazonian burns.
Acknowledgments
The
Pew Scholars Program in Conservation and the Environment, the National Council
of Scientific and Technological Development (CNPq AIs 350230/97-98 and
523980/96-5) and the National Institute for Research in the Amazon (INPA PPIs
5-3150 and 1-3160) provided financial support.
We thank the INPA/Smithsonian Institution Biological Dynamics of Forest
Fragments Project for great help and tolerance in arranging the logistics of
field access and facilitating the administration of field labor, and to A.C.
Hollebein (owner of Fazenda Dimona) for allowing us to conduct the study on his
ranch. Reinaldo Imbrozio Barbosa and
Crisanto Lopes de Oliveira made contributions to the fieldwork. INPA's Center for Forest Products Research
(CPPF) kindly allowed use of their ovens.
Summer V. Wilson and two anonymous referees made useful comments on the
manuscript. This is publication number
306 in the Biological Dynamics of Forest Fragments Technical Series.
References
Araújo, T.M., 1995. Investigação das taxas de dióxido de carbono gerado em queimadas na região Amazônica, Ph.D. dissertation in mechanical engineering, Universidade Estadual Paulista (UNESP), Guaratinguetá, São Paulo, Brazil, 212 pp.
Araújo, T.M., Carvalho, Jr., J.A., Higuchi, N., Brasil, Jr., A.C.P.,
Mesquita, A.L.A., 1999. A tropical
rainforest clearing experiment by biomass burning in the state of Pará, Brazil,
Atmospheric Environment, 33, 1991-1998.
Brazil, Projeto RADAMBRASIL, 1978. Levantamento de Recursos Naturais, Vol. 18 [Manaus], Ministério das Minas e Energia, Departamento Nacional de Produção Mineral (DNPM), Rio de Janeiro, Brazil, 623 pp. + attachments.
Carvalho, Jr., J.A., Higuchi, N., Araújo, T.M., Santos, J.C., 1998. Combustion completeness in a rainforest
clearing experiment in Manaus, Brazil, Journal of Geophysical Research
(Atmospheres), 103(D11), 13,195-13,199.
Brazil, IBGE and IBDF, 1988. Mapa de Vegetação do Brasil, map scale 1:5,000,000, Ministério da Agricultura, Instituto Brasileiro de Desenvolvimento Florestal (IBDF) and Presidência da República, Instituto Brasileiro de Geografia e Estatística (IBGE), IBAMA, Brasilia, Brazil.
Carvalho, Jr., J.A., Santos, J.M., Santos, J.C., Leitão, M.M.,
Higuchi, N., 1995. A tropical
rainforest clearing experiment by biomass burning in the Manaus region,
Atmospheric Environment, 29(17), 2301-2309.
Chambers, J.Q., 1998. The Role of Large Wood in
the Carbon Cycle of Central Amazon Rain Forest, Ph.D. dissertation in ecology,
evolution and marine biology, University of California at Santa Barbara, Santa
Barbara, CA, 117 pp.
Corrêa, A.A., 1988. Conversão química de madeiras da Amazônia--carvão e briquettes de carvão vegetal, Acta Amazonica, 18(1-2), 93-108.
Fearnside, P.M., 1986. Human Carrying Capacity
of the Brazilian Rainforest, Columbia University Press, New York, 293 pp.
Fearnside, P.M., 1989. Burn quality prediction
for simulation of the agricultural system of Brazil's Transamazon Highway
colonists, Turrialba, 39, 229-235.
Fearnside, P.M., 1990. Fire in the tropical
rain forests of the Amazon Basin, In: J.G. Goldammer (Ed.), Fire in the
Tropical Biota: Ecosystem Processes and Global Challenges, Springer-Verlag,
Heidelberg, Germany, pp. 106-116.
Fearnside, P.M., 1994. Biomassa das florestas Amazônicas brasileiras, In: Anais do Seminário Emissão X Seqüestro de CO2, Companhia Vale do Rio Doce (CVRD), Rio de Janeiro, Brazil, pp. 95-124.
Fearnside, P.M., nd. Global warming and
tropical land-use change: Greenhouse gas emissions from biomass burning,
decomposition and soils in forest conversion, shifting cultivation and
secondary vegetation, Climatic Change (in press).
Fearnside,
P.M., Graça, P.M.L.A., Leal Filho, N., Rodrigues, F.J.A., Robinson, J.M., 1999.
Tropical forest burning in
Brazilian Amazonia: Measurements of biomass loading, burning efficiency and
charcoal formation at Altamira, Pará, Forest Ecology and Management, 123,
65-79.
Fearnside, P.M., Leal Filho, N., Fernandes,
F.M., 1993. Rainforest burning and the global carbon budget: Biomass,
combustion efficiency and charcoal formation in the Brazilian Amazon, Journal
of Geophysical Research (Atmospheres), 98(D9), 16,733-16,743.
Graça, P.M.L.A., Fearnside, P.M., Cerri, C.C.,
1999. Burning of Amazonian forest in Ariquemes, Rondônia, Brazil: Biomass,
charcoal formation and burning efficiency, Forest Ecology and Management, 120,
179-191.
Guild, L.S., Kauffman, J.B., Ellingston, L.J.,
Cummings, D.L., Castro, E.A., 1998. Dynamics associated with total aboveground
biomass, C, nutrient pools, and biomass burning of primary forest and pasture
in Rondonia, Brazil during SCAR-B, Journal of Geophysical Research
(Atmospheres), 103(D24), 32,091-32,100.
Kauffman, J.B., Cummings, D.L., Ward, D.E.,
Babbitt, R., 1995. Fire in the Brazilian Amazon. 1. Biomass, nutrient pools,
and losses in slashed primary forests, Oecologia, 104, 397-408.
Klinge, H., Rodrigues, W.A., 1974. Phytomass estimation in a Central Amazonian rain forest, In: H.E. Young
(Ed.), IUFRO Biomass Studies, University Press, Orono, Maine, pp. 339-350.
Kuhlbusch, T.A.J., 1998. Black carbon and the
carbon cycle, Science, 280, 1903-1904.
Laurance, W.F., Fearnside, P.M., Laurance, S.G.,
Delamonica, P., Lovejoy, T.E., Rankin-de-Merona, J.M., Chambers, J.Q., Gascon,
C., 1999. Relationship between soils and Amazon forest biomass: a
landscape-scale study, Forest Ecology and Management, 118, 127-138.
Laurance, W.F., Laurance, S.G., Ferreira, L.V.,
Rankin-de Merona, J.M., Gascon, C., Lovejoy, T.E. 1997. Biomass collapse in
Amazonian forest fragments. Science, 278, 1117-1118.
Laurance, W.F., Perez,
D., Delamonica, P., Fearnside, P.M., Agra, S., Jerozolinski, A., Pohl, L.,
Lovejoy, T.E., nd. Rain forest fragmentation and the structure of Amazonian
liana communities, Ecology (in press).
Lovejoy, T.E., Bierregaard, Jr., R.O., 1990.
Central Amazonian forests and the Minimum Critical Size of Ecosystems Project,
In: A.H. Gentry (Ed.), Four Neotropical Forests, Yale University Press, New
Haven, Connecticut, pp. 60-71.
McWilliam, A.-L.C., Roberts, J.M., Cabral,
O.M.R., Leitão, M.V.B.R., de Costa, A.C.L., Maitelli, G.T., Zamparoni,
C.A.G.P., 1993. Leaf-area index and above-ground biomass of terra firme
rain forest and adjacent clearings in Amazonia, Functional Ecology, 7, 310-317.
Van Wagner, C.E., 1968. The line intersect
method for forest fuel sampling, Forest Science, 14, 20-26.
Warren, W.G., Olsen, P.F., 1964. A line
intersect technique for assessing logging waste, Forest Science, 10, 267-276.
Figure captions
Fig.
1. Location of the study area.
Fig. 2. Layout
of plots.
Fig. 3. Pre-burn
distribution of biomass among diameter classes and contributions to carbon of each
class in four studies of burning in felled primary forest in Amazonia: (A)
Dimona 1990 (this study), (B) Dimona 1984 (Fearnside et al., 1993), (C)
Ariquemes 1994 (Graça et al., 1999), and (D) Altamira 1986 (Fearnside et al.,
1999).
Fig. 4. Distribution
of volume by diameter range in the > 10-cm diameter wood class for post-burn
plots.
Fig. 5. Burning
efficiency in Brazilian Amazonia found by different methods. Method 1: this
study, Fearnside et al. (1993, 1999), Graça et al. (1999); Method 2: Kauffman
et al. (1995), Guild et al.
(1998); Method 3: Araújo et al. (1999), Carvalho, Jr. et al. (1995, 1998).
|
Table 1 Initial
biomass stocks at Fazenda Dimona (Manaus) 1990 |
|
||||||||||||||||
|
|
|
|
|
|
|
|
|
|
|
||||||||
|
Plota |
Plot type |
Pre-burn measurements |
|
Post-burn measurements |
|
||||||||||||
|
Wood >10
cm diameter (Mg
ha-1) |
Other components (Mg
ha-1) |
Total |
|
Wood >10
cm diameter (Mg
ha-1) |
Other components (Mg
ha-1) |
Total |
|||||||||||
|
|
|||||||||||||||||
|
|
|||||||||||||||||
|
|
|||||||||||||||||
|
F2 |
Pre-burn |
201.25 |
81.53 |
282.77 |
|
|
|
|
|||||||||
|
F4 |
Pre-burn |
311.38 |
110.00 |
421.38 |
|
|
|
|
|||||||||
|
F6 |
Pre-burn |
356.49 |
117.69 |
474.19 |
|
|
|
|
|||||||||
|
P2 |
Pre-burn |
403.13 |
116.52 |
519.65 |
|
|
|
|
|||||||||
|
P4 |
Pre-burn |
178.65 |
95.78 |
274.44 |
|
|
|
|
|||||||||
|
P6 |
Pre-burn |
225.97 |
74.85 |
300.82 |
|
|
|
|
|||||||||
|
F1 |
Post-burn |
140.24b |
|
|
|
113.15 |
28.68 |
141.83 |
|||||||||
|
F3 |
Post-burn |
455.67b |
|
|
|
379.15 |
47.82 |
426.97 |
|||||||||
|
F5 |
Post-burn |
197.81b |
|
|
|
162.74 |
28.25 |
190.99 |
|||||||||
|
P1 |
Post-burn |
214.11b |
|
|
|
170.06 |
21.71 |
191.77 |
|||||||||
|
P3 |
Post-burn |
329.62b |
|
|
|
261.35 |
38.43 |
299.78 |
|||||||||
|
P5 |
Post-burn |
224.23b |
|
|
|
202.51 |
26.83 |
229.34 |
|||||||||
|
|
|
|
|
|
|
|
|
|
|||||||||
|
|
Mean |
269.88 |
98.40 |
378.87c |
|
214.83 |
31.95 |
246.78 |
|||||||||
|
|
SD |
94.53 |
16.71 |
98.42 |
|
86.00 |
8.65 |
93.75 |
|||||||||
|
|
n |
12 |
6 |
6 |
|
6 |
6 |
6 |
|||||||||
|
|
|
|
|
|
|
|
|
|
|||||||||
|
a Plots 60 m2
(2 × 30 m). |
|||||||||||||||||
|
b Post-burn
wood >10 cm in diameter estimated from direct measurement made after the
burn, adjusted by the percent of loss determined by LIS to each plot. |
|||||||||||||||||
|
c Pre-burn
total differs from 369.3±186.9 Mg ha-1 derived in Table 2 because pre-burn
biomass of palms >10 cm in diameter used in Table 2 is back calculated
from post-burn biomass using LIS estimates of losses (see Table 2, note b). |
|||||||||||||||||
Table 2
Above-ground biomass dry weight before and after burn
|
Fraction |
Pre-burn biomass (Mg ha-1 ± SD) |
Post-burn biomass (Mg ha-1 ± SD) |
|
Wood <5 cm |
30.5±15.0 |
6.2±3.8 |
|
Wood 5-10 cm |
24.5±16.9 |
11.8±11.8 |
|
Wood >10 cma |
269.9±120.5 |
222.7±99.4 |
|
Vines <5 cm |
4.4±4.8 |
0.6±0.7 |
|
Vines 5-10 cm |
3.2±4.4 |
0.8±1.8 |
|
Vines >10 cm |
3.2±9.7 |
0.3±1.1 |
|
Litter |
30.0±12.9 |
9.6±9.1 |
|
Palms ≤10 cm |
2.2±2.7 |
0.6±0.8 |
|
Palms >10 cmb |
1.3 |
1.1 |
|
Charcoal |
- |
4.3±5.9 |
|
Total |
369.3±186.9 |
257.9±134.4 |
a Pre-burn biomass for this class was calculated from the mean from the pre-burn and post-burn plots, correcting the post-burn results for the percentage burned found by LIS for each plot. Post-burn biomass was estimated indirectly using the mean percentage consumed in post-burn plots based on LIS applied to pre-burn biomass in these plots.
b Only one palm >10 cm in diameter was present in LIS (the data used here); direct measurements for this category indicated 0.5±2.1 Mg ha-1 in pre-burn plots and 2.2±5.8 Mg ha-1 in post-burn plots.
Table 3
Above-ground carbon stock before and after
the burn
|
|
Pre-burn
|
|
Post-burn |
|
Carbon partitioning (% of total pre-burn C left in fraction) |
|
||||||||||||||
|
Fraction |
Carbon content (%) |
Carbon
stock (Mg
ha-1) |
Carbon content
(%) |
Carbon
stock
(Mg ha-1) |
|
|||||||||||||||
|
Wood <5 cm |
48.4 |
14.8 |
49.1 |
3.0 |
1.7 |
|
||||||||||||||
|
Wood 5-10 cm |
48.4 |
11.9 |
49.1 |
5.8 |
3.2 |
|
||||||||||||||
|
Wood >10 cm |
49.3 |
133.0 |
49.9 |
111.1 |
61.2 |
|
||||||||||||||
|
Vines <5 cm |
49.4 |
2.2 |
49.0 |
0.3 |
0.2 |
|
||||||||||||||
|
Vines 5-10 cm |
49.4 |
1.6 |
49.0 |
0.4 |
0.2 |
|
||||||||||||||
|
Vines >10 cm |
49.4 |
1.6 |
49.0 |
0.1 |
0.1 |
|
||||||||||||||
|
Litter |
51.1a |
15.3 |
51.1 |
4.9 |
2.7 |
|
||||||||||||||
|
Palms ≤10 cm |
51.1 |
1.1 |
51.1 |
0.3 |
0.2 |
|
||||||||||||||
|
Palms >10 cm |
49.3b |
0.2 |
49.9b |
1.1 |
0.6 |
|
||||||||||||||
|
Charcoal |
|
|
74.8c |
3.2 |
1.8 |
|
||||||||||||||
|
Total |
|
181.7 |
|
130.2 |
71.7 |
|
||||||||||||||
|
Presumed release |
|
|
|
51.4 |
28.3 |
|
|||||||||||||
|
a
Carbon content assumed equal to that of pre-burn "leaves." |
|
|
|
|
|||||||||||||||
|
b
Carbon content assumed equal to that of wood >10 cm in diameter. |
|
|
|
|
|||||||||||||||
|
c
Charcoal carbon from Corrêa (1988). |
|
|
|
|
|||||||||||||||
Table 4
Percentage of biomass consumed by the fire
and water content in plant tissues before the burn
|
|
|
|
|
Fraction (diameter size class) |
Consumed (%) |
Pre-burn water content (%) |
|
Wood <5 cm |
79.8 |
30.3 |
|
Wood 5-10 cm |
52.1 |
41.4 |
|
Wood >10 cm* |
17.5 |
46.0 |
|
Vines <5 cm |
86.7 |
71.8 |
|
Vines 5-10 cm |
74.6 |
127.1 |
|
Vines >10 cm |
92.0 |
132.4 |
|
Litter |
68.0 |
97.9 |
|
Palms ≤10 cm |
75.0 |
276.4 |
|
Palms >10 cm* |
13.6* |
108.4 |
*
Percentage consumed of wood and palms >10 cm in diameter determined by LIS.
|
Table 5 Above-ground
biomass estimates in the Manaus area |
||||||
|
Location with
respect to this study |
Above-ground
biomass reported (Mg ha-1) |
Missing
components |
Above-ground
biomassa (Mg ha-1) |
Reference |
Commentb |
|
|
-- |
369±189 |
None |
369±189 |
This study |
Fazenda Dimona |
|
|
1.6 km W |
265 |
None |
265 |
Fearnside et
al., 1993 |
Fazenda Dimona |
|
|
Adjacent
reserves at Fazenda Dimona and in two other ranches up to 15 km E |
356±47 |
Dead
above-ground biomass, vines |
384c |
Laurance et al.,
1999 |
PDBFF reserves |
|
|
14 km S |
424.9 |
None |
424.9 |
Carvalho, Jr. et
al., 1995 |
INPA
silviculture experimental station |
|
|
14 km SSE |
275 |
None |
275 |
McWilliam et
al., 1993 |
EMBRAPA
experimental station |
|
|
50 km SW |
531.8 |
None |
531.8 |
Klinge et al.,
1974 |
Reserva Egler |
|
|
Mean for this forest
type in the state of Amazonas |
332 |
None |
332 |
Fearnside, 1994 |
|
|
|
a Dry weight of
all above-ground live and dead biomass, including palms, vines, epiphytes,
leaves, understory and litter. b PDBFF = Biological
Dynamics of Forest Fragments Project; INPA = National Instititute for
Research in the Amazon; EMBRAPA = Brazilian Enterprise for Agriculture and
Ranching Research. c Vines
approximately 8 Mg ha-1 (Laurance et al., nd); dead above-ground
biomass 20 Mg ha-1 (Chambers, 1998, p. 58). |
|
|||||
|
Table 6 Types of burning
efficiency studies in primary forest burns |
|
||||
|
|
|
|
|
|
|
|
|
|
|
|
|
|
|
Method |
Major features of procedure |
Study |
Location |
Burning efficiency reported (%) |
Comments |
|
|
|
|
|
|
|
|
1 |
Line-intercept
sampling for pieces > 10 cm diameter (with marked measurement points on
each piece); destructive sampling for smaller size classes and litter. |
This study |
Fazenda Dimona, Amazonas |
28.3 |
|
|
Fearnside et al., 1993 |
Fazenda Dimona, Amazonas |
27.6 |
Destructive quadrats in 10 × 10-m format; separate post-burn LIS. |
||
|
Fearnside et al., 1999 |
Altamira, Pará |
41.9 |
Mean of 3 burns. |
||
|
Graça et al., 1999 |
Ariquemes, Rondônia |
36.8 |
|
||
|
|
|
|
|
|
|
|
2 |
Line-intercept sampling for all diameter classes (without marked measurement points on each piece). Destructive sampling for litter, live seedlings and resprouts. |
Kauffman et al., 1995 |
Jacundá, Pará |
51.5 |
|
|
Kauffman et al., 1995 |
Marabá, Pará |
51.3 |
|
||
|
Kauffman et al., 1995 |
Santa Barbara, Rondônia |
40.5 |
|
||
|
Kauffman et al., 1995 |
Jamarí, Rondônia |
56.1 |
|
||
|
Guild et al., 1998 |
Site 1, Rondônia |
47 |
|
||
|
Guild et al., 1998 |
Site 2, Rondônia |
54 |
|
||
|
|
|
|
|
|
|
|
3 |
Estimate of diameter
reduction in mm (method and sampling unspecified) extrapolated to all volume
with diameter above specified minimum.
Smaller material with direct weighing of same pre- and post-burn
samples. |
Araújo et al., 1999 |
Tomé-Açu, Pará |
20.1 |
Diameter reduction
of 3 mm for trunks > 5 cm diameter and branches > 10 cm diameter. |
|
Carvalho et al., 1995 |
Manaus, Amazonas |
25.1 |
Diameter reduction
of 5 mm for trunks > 5 cm diameter and branches > 10 cm diameter. |
||
|
Carvalho et al., 1998 |
Manaus, Amazonas |
20.5 |
Separate diameter
reduction measurements for each piece + measurement of length to which it
applies. |
||
Fig. 1
Fig. 2
Fig. 3
Fig. 4
Fig. 5