The
text that follows is a PREPRINT.
Please cite as:
Fearnside, P.M. 2004. Greenhouse gas emissions from hydroelectric
dams: Controversies provide a springboard for rethinking a supposedly “clean”
energy source, Climatic Change
66(1-2): 1-8.
ISSN:
0165-0009
Copyright:
Springer.
The original publication is available
at www.springerlink.com
<Publisher
link-1>: <publisher
link-2>
GREENHOUSE GAS EMISSIONS FROM
HYDROELECTRIC DAMS: CONTROVERSIES PROVIDE A SPRINGBOARD FOR RETHINKING A
SUPPOSEDLY “CLEAN” ENERGY SOURCE
Philip M. Fearnside
Department of Ecology
National Institute for Research in the Amazon (INPA)
C.P. 478
69011-970 Manaus, Amazonas
Brazil
Email: pmfearn@inpa.gov.br
28 December 2003
Corrected:
15 January 2004
In press: Climatic Change
GREENHOUSE GAS
EMISSIONS FROM HYDROELECTRIC DAMS: CONTROVERSIES PROVIDE A SPRINGBOARD FOR
RETHINKING A SUPPOSEDLY “CLEAN” ENERGY SOURCE
PHILIP M. FEARNSIDE
Department of Ecology, National Institute for
Research in the Amazon (INPA), C.P. 478, 69011-970 Manaus, Amazonas, Brazil
Email: pmfearn@inpa.gov.br
1. Methane
Nearly everyone has opened a bottle
of Coca Cola and seen the many tiny bubbles that immediately emerge from the
liquid. The gas (in this case carbon
dioxide) is dissolved in the water that makes up most of the soft drink. The solubility of the gas is higher under
pressure in the closed bottle than it is when the pressure is released by
opening it – the result of the chemical principle known as Henry’s law, which
holds that the solubility of a gas in a liquid is directly proportional of the
partial pressure of the gas. Divers are
familiar with the fact that a sudden lowering of pressure can cause gases to
come out of solution, nitrogen bubbles in the blood (“the bends”) being a
deadly risk of the rapid lowering of pressure that occurs if a diver rises to
the surface too fast. In the case of
water released from deep in the water column of a hydroelectric dam, the effect
of pressure is compounded by the effect of temperature, as the warming of the
water also reduces gas solubility (Le Chatalier’s principle). The effect of pressure release is both great
and immediate, while reaching a new temperature equilibrium provides a short
delay for the effect of Le Chatalier’s principle.
The difference in pressure between a
closed and an open bottle of Coca Cola is minor compared to the pressure at depth
in a hydroelectric reservoir. Most of us
have experienced the pressure on our eardrums when we dive two or three meters
to the bottom of a swimming pool. The
pressure at 34.6 m – the depth at the turbine intake at Brazil’s Tucuruí Dam –
is very much more (about 3 atmospheres).
At about 10-m depth a thermocline impedes water mixing and diffusion of
methane (CH4) to the surface. As one descends further in the water
column, the concentration of CH4 increases (Fig. 1). The concentration in the Tucuruí reservoir
measured at a depth of 30 m was 6 mg/liter of water in March 1989 (data of José
G. Tundisi published by Rosa et al., 1997, p. 43); while the concentration at
34.6 m is estimated at 7.5 mg/liter after adjustment for the annual cycle
(based on measurements from the Petit Saut dam in French Guyana: Galy-Lacaux et
al., 1999) and the conservative assumption that the concentration does not
continue to increase below 30 m depth in the water column.
(Fig.
1 here)
When the water emerges from the turbines
the pressure instantly drops to a level of one atmosphere, and the great
majority of the dissolved gas can be expected to be released immediately. For example, when water samples are brought
to the surface from the bottom of a reservoir in a sampling flask the water
foams like Coca Cola when the flask is opened.
Gases released in this way include both CO2 and CH4,
but, even though present in smaller quantities, it is the CH4 that
makes the impact of hydroelectric dams a concern for global warming.
Methane is also released from the
water passing through the spillway, where gas release will be driven not only
by the change in pressure and temperature but also by the sudden provision of a
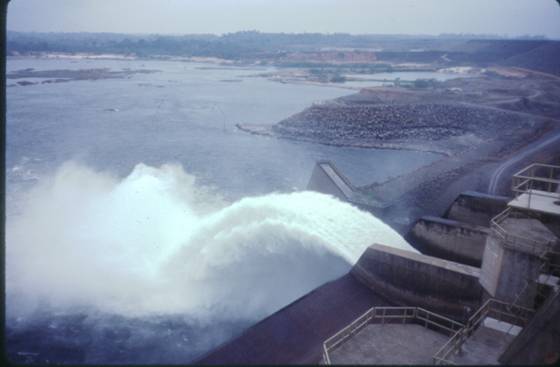
vast surface area when the water is pulverized into droplets. At Tucuruí’s spillways, water shoots out of a
narrow horizontal slit at a depth 20 m below the surface. Water at this depth has a substantial load of
methane (estimated at 3.1 mg/liter on average over the year in water released
by the spillway: Fearnside, 2002a: 82).
The ski-jump design of the spillway is intended to maximize
oxygenization in the river below the dam, but the other side of this coin is
the immediate release of methane contained in the water (Fig. 2). Because an average of 353.6 × 10¹²
liters of water pass through the Tucuruí Dam annually, either through the
turbines or the spillways, the amount of CH4 exported through these
structures is tremendous. At Tucuruí in
1991, considering the assumptions regarding percentages released of the CH4
from this water, total 0.7-1.2 × 10⁶ Mg of CH4 gas, or
4.0-7.1 × 10⁶ Mg of CO2 carbon equivalent if computed
using the global warming potential of 21 adopted by the Kyoto Protocol
(Fearnside, 2002a). The total emission,
including surface emissions of methane and above-water biomass emissions of
methane and carbon dioxide, is 7.0-10.1 × 10⁶ Mg of CO2
carbon equivalent—an emission equivalent to the fossil-fuel carbon released by
the city of São Paulo.
(Fig.
2 here)
One can calculate that the effects
of pressure and temperature would release almost all of the methane contained
in the water when it passes through either the turbines or the spillway. The partial pressure of methane in the
atmosphere is very low (1.5 × 10⁻⁶).
Given the Henry’s Law constant of CH4 of 67.4 kPa m3
mol-1 (Anonymous, 1999, p. 8-92), or 0.681 atm/(mol/liter), the
equilibrium of CH4 at one atmosphere pressure and 25o C
temperature is only 0.035 mg/liter. When
water emerges from the turbines of Tucuruí with a methane concentration of 7.5
mg/liter, 99.5% of this is lost as the combined effect of lowering the pressure
to one atmosphere and raising the temperature to the neighborhood of 25o
C. The role of temperature in this can
be visualized from the relationship of temperature to CH4 solubility
(Geventman, 1999). For example an
increase in temperature from 15o C to 25o C reduces the
solubility of CH4 in water by 18.3%.
Choosing the method to estimate
methane release is critical to the conclusions reached: if the method chosen fails to detect a
release, the appropriate conclusion may not be that there is no release, but
rather that one has simply been looking in the wrong place. For example, Rosa et al. (2004) treat turbine
and spillway emissions as negligible, based on measurements of surface fluxes
made from several hundred meters to several tens of kilometers below the Petit
Saut Dam (Galy-Lacaux et al., 1997).
Unfortunately for the environment, the gas release from the water emerging
from the turbines probably occurs within a few seconds – like the bubbles
released by a bottle of Coca Cola. The
fact that little or none is still being released as the water flows further
down the river is irrelevant; in the case of the surface-flux measurements they
cite from French Guiana, it is doubly unsurprising that little methane emission
was found because the measurements were made below a 4-m high weir designed to
aerate the water (Gosse, 1999).
The amount of methane released at
the turbines and spillway is best calculated by difference, based on the CH4
concentration in the water at the turbine depth behind the dam and in the water
in the river below. Because the new
equilibrium is reached very quickly when the water emerges from the turbines,
there is no time for bacteria to work to reduce CH4 to CO2
before the gas is released to the atmosphere.
2. Carbon Dioxide
Carbon dioxide emissions from reservoirs are
quite different from methane emissions in terms of their net impact on global
warming. Unlike methane, only a portion
of the carbon dioxide emitted can be counted as a net impact because much of
the CO2 gas flux observed is cancelled out by uptakes in the
reservoir. Methane does not enter
photosynthetic pathways, although it is eventually reduced to CO2
that can be removed by photosynthesis.
For the approximately 10 years, on average, that each methane molecule
remains in the atmosphere the global warming it causes must be considered a net
impact of the dam. The natural methane
emission from a stretch of undammed river is small compared to emission from a
reservoir (dams are usually built at the locations of former rapids, rather
than flat swampy areas where methane would be produced in natural
wetlands). The reservoirs become virtual
methane factories, with the rise and fall of the water level in the reservoir
alternately flooding and submerging large areas of land around the shore; soft
green vegetation quickly grows on the exposed mud, only to decompose under
anaerobic conditions at the bottom of the reservoir when the water rises
again. This converts atmospheric carbon
dioxide into methane, with a much higher impact on global warming than the CO2
that was removed from the atmosphere when the plants grew (21 times more per
ton of gas, or 7.6 times more per ton of carbon).
CO2 that is released from
the water surface in the reservoir, as well as CO2 released at the
turbines or the spillway, cannot be considered a net emission. The carbon contained in this CO2
will have come from sources such as photosynthesis in the reservoir
(phytoplankton, macrophytes), from organic
material and eroded soil washed into the water from the land, and from
dissolved organic carbon that enters the river from ground water-(for example
from root exudates and litter decomposition).
CO2 carbon derived from photosynthesis in the reservoir is
merely recycled from the atmosphere, and would be cancelled out if measurements
were available of fluxes into the water as well as out of it. The carbon from the land can be considered to
be subject to aerobic decomposition and emission as CO2 in the
reference case without a dam, and so cannot be considered a dam impact.
Carbon in the reservoir that is not
oxidized may be deposited in sinks such as the sediments at the bottom of the
reservoir or downstream in the floodplain (várzea)
or in the delta, or in ocean sediments, or it may remain as dissolved organic
carbon (DOC) for a long period. Because
what is deposited in the reservoir sediments would probably otherwise have been
deposited in one of the other sinks, this carbon removal cannot be counted as a
reservoir benefit.
One source of carbon dioxide must be
counted as a net impact of dam construction.
This is the CO2 released by above-water decomposition of the
portions of the flooded trees that are left projecting out of the water. The amount of carbon involved is substantial
during the first decade after reservoir filling. Estimates of emissions from this source for
the year 1990 (i.e., the baseline
year for national greenhouse gas inventories under the climate convention)
totaled 10 million tons of carbon for the existing dams in Brazilian Amazonia:
2.55 at Tucuruí, 6.43 at Balbina, 1.13 at Samuel and 0.01 at Curuá-Una
(Fearnside, 1995, p. 16).
3. Comparison of Hydro with Other
Energy Sources
Emissions from several sources are
concentrated early in the life of a dam, giving the greenhouse impact of
hydropower a time profile that is significantly different from the emissions
that would be produced from generating the same amount of electricity from
fossil fuels. Dam construction
emissions, such as those from cement and steel, even occur several years before
any power generation begins. CO2
from above-water decay of dead trees and CH4 from the soft parts
(leaves) of the initial vegetation and from macrophyte decomposition are
highest during the first years after filling a reservoir. Any weighting of the emissions impacts for
time preference will strongly favor fossil fuel alternatives over hydroelectric
generation (Fearnside, 1997, 2002b).
Rosa et al. (2004) cast the debate
on hydroelectric emissions as one of two sides: one composed of the
hydroelectric lobby that claims dams emit no greenhouse gases, and the other
composed of those who are implied to be subject to “the lures of the thermo-power
and nuclear-power lobbies.” I would suggest that those who have pointed out
that hydroelectric dams have substantial emissions are not the pawns of either
lobby.
Although not the simple struggle
between lobbies suggested by Rosa et al. (2004), the political context of this
debate is noteworthy. An influential
view in the Brazilian government is that expressed by José Domingos Gonzalez Miguez, head of
the climate sector of the Ministry of Science and Technology (MCT), in a
workshop on the greenhouse gas emissions from reservoirs held at MCT’s Center
for the Management of Strategic Studies in Brasília in February 2002 (one year
before Luis Pinguelli Rosa was appointed to his current post as head of
ELETROBRÁS). In the transcript of the
workshop, which is maintained on a public website administered by the MCT
climate sector, Miguez states:
“We [the MCT climate sector] talked with Prof. Pinguelli [Rosa] and I asked the help of ELETROBRÁS [on the subject of greenhouse
gas emissions from dams]; actually, it
was ELETROBRÁS that coordinated this work [i.e., the work reported in Rosa et al., 2004] exactly because of this, because this subject was becoming
political. It has a very great impact at
the World level; we are going to suffer pressure from the developed countries
because of this subject. And, this
subject was little known. It is
mistreated. It is mistreated and
continues to be mistreated by Philip Fearnside himself, and we have to be very
careful. The debate that is taking place
now in the press shows this clearly; that is to say, you can take any one-sided
statement to show that Brazil is not clean, that Brazil is very remiss, that
Brazil, implicitly, will have to take on a commitment [to reduce emissions] in the future. This is a great political debate and we are
preparing ourselves for it.” (Brazil, MCT, 2002).
Needless to say, the
idea that research in this area must be carefully “coordinated” in order to
assure that only politically palatable conclusions are reached is not the only
viewpoint. As unpopular as it may be, I
defend the position that all sources
and sinks must be quantified and taken into account in policy making, in this
case including both the methane emitted from the turbines and spillways and the
carbon dioxide from above-water decay of standing trees in Amazonian
reservoirs. In 1990 at Tucuruí, for
example, these sources (not counted in the study coordinated by ELETROBRÁS)
made up at least 93% of the total emission (Fearnside, 2002a).
ELETROBRÁS, the government agency
for planning and promoting energy development throughout Brazil, has massive
plans for hydroelectric dam construction in Amazonia. The only time the full extent of these plans
has been revealed to the public was in the 2010 Plan, which leaked to the
public and was subsequently released officially in December 1987. All of the 79 dams listed for Amazonia,
independent of the expected date of construction, total 10 million hectares of
water area (Brazil, ELETROBRÁS, 1987, p.
150). This is an area
approximately the size of the US state of Kentucky, and represents 2% of
Brazil’s 9-state Legal Amazon region, or 3% of the portion of the region with
tropical forest. In the wake of
criticism of this plan, and especially after a 1989 confrontation with
indigenous peoples over plans for six dams in the Xingu River basin (the first
of which, now called Belo Monte, is currently the top priority of ELETROBRÁS
for construction), the agency has since only revealed plans for successive
short lists of dams slated for construction over time horizons of up to 10
years, rather than discuss the overall plan.
The time scale for construction of specific dams has stretched
repeatedly as a result of the financial limitations of the country’s economy
and government budget, but the overall goal remains unchanged. These dams imply a multitude of social and
environmental impacts, of which impact on greenhouse-gas emissions is one
(Fearnside, 1999, 2001).
Controversies provide a springboard
for rethinking the impacts of hydroelectric dams, both in terms of the amounts
of gases emitted and the theoretical structure most appropriate for comparing
their impacts: the choices of what
emissions to count or not count, and the decisions made, by default or by
design, on how emissions are treated when they occur at different times and are
of gases with different lifetimes. This
springboard allows a rethinking of the role of hydroelectric dams in climatic change
and the proper counting of the environmental costs of dams. This accounting of environmental costs is
needed as an input to assessing the appropriate role of building new dams as a
part of development in
Acknowledgments
I thank the National
Council for Scientific and Technological Development (CNPq)(Proc. 470765/01-1)
for financial support and Bruce Forsberg for comments.
References
Brazil, ELETROBRÁS: 1987, Plano 2010: Relatório Geral. Plano Nacional de Energia Elétrica
1987/2010 (Dezembro de 1987, Centrais Elétricas do Brasil (ELETROBRÁS),
Brasília, DF, Brazil. 269 pp.
Brazil, MCT: 2002, ‘Degravação do workshop: Utilização de Sistemas Automáticos de Monitoramento e Medição de Emissões de Gases de Efeito Estufa da Qualidade da Água em Reservatórios de Hidrelétricas’, Centro de Gestão de Estudos Estratégicos do MCT, Brasília – DF, 06 de fevereiro de 2002. Ministério da Ciência e Tecnologia (MCT), Brasília, DF, Brazil. http://www.mct.gov.br/clima/brasil/doc/workad.doc.
Fearnside, P. M.: 1995, ‘Hydroelectric dams in
the Brazilian Amazon as sources of 'greenhouse' gases’, Environ. Conserv. 22,
7-19.
Fearnside, P. M.,
1997: ‘Greenhouse-gas emissions from Amazonian
hydroelectric reservoirs: The example of Brazil's Tucuruí Dam as compared to
fossil fuel alternatives’, Environ.
Conserv. 24, 64-75.
Fearnside, P. M., 1999, ‘Social Impacts of
Brazil's Tucuruí Dam’, Environ. Manage.
24, 485-495.
Fearnside, P.M.:
2001, ‘Environmental impacts of Brazil's Tucuruí Dam: Unlearned lessons for
hydroelectric development in Amazonia’, Environ.
Manage. 27, 377-396.
Fearnside,
P. M.: 2002a, ‘Greenhouse gas emissions
from a hydroelectric reservoir (Brazil’s Tucuruí Dam) and the energy policy
implications’, Water, Air and Soil
Pollution 133,
69-96.
Fearnside, P. M.: 2002b, ‘Time preference in global warming calculations: A
proposal for a unified index’, Ecological
Econ. 41, 21-31.
Galy-Lacaux, C., Delmas, R., Jambert, C., Dumestre, J.-F., Labroue, L.,
Richard, S., and Gosse, P.: 1997, ‘Gaseous emissions and oxygen consumption in
hydroelectric dams: A case study in French Guyana’, Global Biogeochem. Cycles 11,
471-483.
Galy-Lacaux, C., Delmas, R., Kouadio, J., Richard, S., and Gosse, P.:
1999, ‘Long-term greenhouse gas emissions from hydroelectric reservoirs in
tropical forest regions’, Global
Biogeochem. Cycles 13, 503-517.
Geventman, L. H.: 1999,
‘Solubility of selected gases in water’, in Lide, D. R. (ed.), CRC Handbook of Chemistry and Physics,
1999-2000 80th edition, CRC Press, Boca Raton, Florida, pp. 8-86
– 8-90.
Gosse, P.: 1999, ‘A
system for reoxygenating the water at Petit-Saut’, http://www.edf.fr/der/html/der/environnement/ptiso.en.htm.
Anonymous: 1999,
‘Aqueous solubility and Henry’s Law constants of organic compounds’, in Lide,
D. R. (ed.), CRC Handbook of Chemistry
and Physics, 1999-2000 80th edition, CRC Press, Boca Raton,
Florida, pp. 8-91 – 8-102.
Rosa, L. P., dos Santos, M. A., Tundisi, J. G., and Sikar, B. M.: 1997, ‘Measurements of greenhouse gas emissions in Samuel, Tucuruí and Balbina Dams’, in Rosa, L. P., and dos Santos, M. A. (eds.), Hydropower Plants and Greenhouse Gas Emissions, Coordenação dos Programas de Pós-Graduação em Engenharia (COPPE), Universidade Federal do Rio de Janeiro (UFRJ), Rio de Janeiro, Brazil, pp. 41-55.
Rosa, L. P., dos Santos, M. A., Matvienko, B., dos Santos, E. O.,
and Sikar, E.: 2004, ‘Greenhouse gases emissions by hydroelectric reservoirs in
tropical regions’, Clim. Change (this issue).
FIGURE LEGENDS
Figure
1. Methane profile at Tucuruí
in March 1989 and as adjusted for an annual cycle (Fearnside, 2002a).
Figure
2. Spillway at Tucuruí. The ski-jump design oxygenates the water, but
at the same time releases methane immediately.
The spillway draws water from a depth of 20 m, where methane
concentration is high (Fearnside, 2001).
Fig. 1
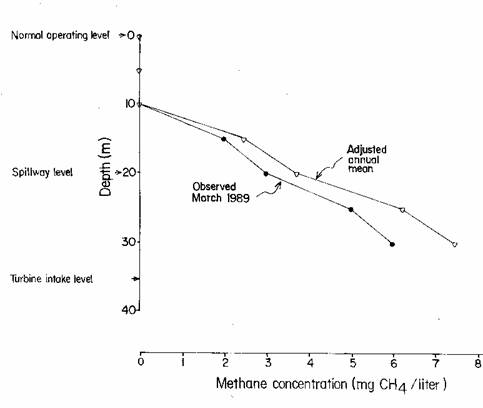
Fig. 2