The text that follows is a PREPRINT.
Please cite
as:
Fearnside,
P.M. 2005.
http://dx.doi.org/10.1007/s00267-004-0100-3
ISSN: 0364-152X
Copyright: Springer.
The original publication is available at www.springerlink.com
BRAZIL'S SAMUEL
DAM: LESSONS FOR HYDROELECTRIC DEVELOPMENT POLICY AND THE ENVIRONMENT IN
AMAZONIA
Running
head: Brazil's Samuel Dam
Philip
M. Fearnside
National
Institute for Research
in the Amazon (INPA)
C.P. 478
69011-970 Manaus-Amazonas
BRAZIL
Fax: 55-92-642-8909
E-MAIL:
PMFEARN@INPA.GOV.BR
Revised:
Main text
8971 words
Environmental Management (Accepted: 14
April 2004)
ABSTRACT / Brazil’s Samuel Dam, which formed a 540-km2 reservoir in the state of Rondônia in 1988, provides lessons for development decisions throughout Amazonia and in other tropical areas. The decision to build the dam was heavily influenced by its role in the political strategies of key decision makers. Samuel illustrates both impacts and benefits of electricity supply and the dilemmas facing decision makers regarding the various options for planned electricity generation. Environmental costs included flooding forest and stimulating illegal logging activity throughout western Amazonia because of an exception opened for Samuel in Brazil’s prohibition of export of raw logs. Samuel emitted substantially more greenhouse gases than would have been emitted by generating the same amount of electricity from oil. Contamination of fish in the reservoir resulted from methylation of mercury present in the soil. Social costs of the dam included resettlement of 238 families of farmers; impacts on indigenous people were indirect. Mitigating measures included faunal rescue and creation of a forest reserve. The lessons of Samuel include the need to consider a full range of alternatives prior to making decisions in practice and the importance of adhering to the logical sequence of decision making, where information is gathered and compared prior to the decision. It also shows the need to maintain flexibility when the costs and benefits of different alternatives change significantly over the course of the project’s planning and execution, as occurred at Samuel.
KEYWORDS:
Amazonia, Brazil, Dams, Hydroelectric dams, Reservoirs
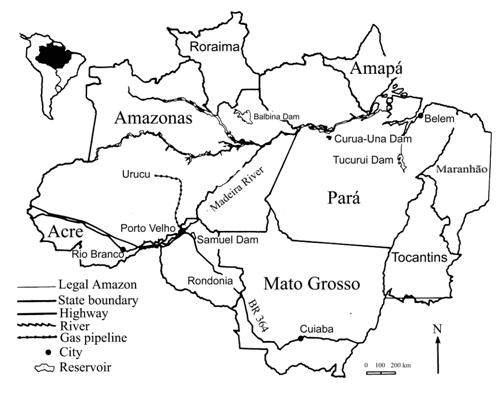
Hydroelectric dam construction is one of the most controversial activities affecting the path of development in tropical countries and is a leading driver of environmental and social problems. In Brazilian Amazonia (Figure 1), the full list of 79 planned dams (regardless of the expected date of construction) would flood approximately 3% of Brazil’s Amazon forest directly (Brazil, ELETROBRÁS 1987, p. 150, see Fearnside 1995). Decisions on future hydroelectric projects unleash chains of events with impacts reaching far beyond the immediate vicinity of the dams and reservoirs.
[Figure 1 here]
In May 2001 Brazil entered into an “energy crisis,” beginning with uncontrolled blackouts in major cities such as São Paulo and Rio de Janeiro, followed by a series of emergency measures to reduce electricity consumption. The “crisis” was a combined result of poor planning of electricity generation infrastructure, inefficient domestic and industrial use of electricity, government subsidy of energy-intensive export products such as aluminum, and low rainfall in hydroelectric catchments. Among the measures implemented is an abbreviation of the environmental review process for new hydroelectric dams and other energy-related infrastructure, effective 18 May 2001 (see: Gazeta Mercantil 2001). This bodes ill for avoiding environmental impacts as Brazil proceeds with its ambitious dam-building program in Amazonia. The new measures also add urgency to making maximal use of the lessons that can be learned from past experience in the region.
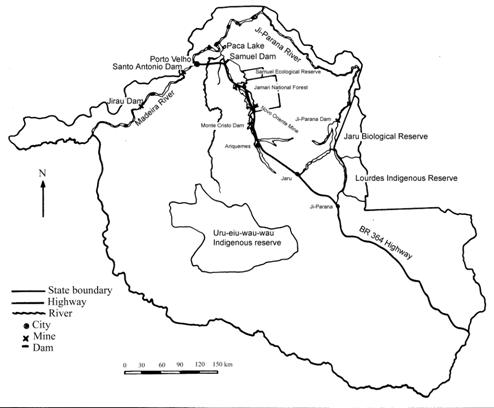
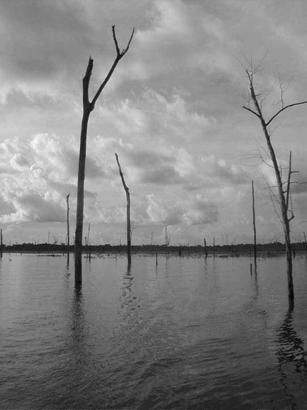
The Samuel Dam is located on the Jamari River at Cachoeira de Samuel (8o 45’S, 63o 25’W), 52 km from the city of Porto Velho, Rondônia (Figure 2). The reservoir was almost all under tropical forest at the time it was flooded. The 15,280-km2 catchment (Brazil, ELETRONORTE nd [C. 1987]) is relatively small, only 24 times larger than the area of the reservoir itself. The streamflow of the Jamari River is consequently limited, with an average annual flow of 366 m3/s (Brazil, ANEEL 2003). This restricts the power produced to a theoretical maximum of 76.0 MW of average generation if all water were used under optimal conditions, considering use of 171 m3/s per turbine with a nominal capacity of 44.41 MW and a power factor of 0.80 (Brazil, ELETRONORTE nd [C. 1987])]. The dam has 216 MW of installed capacity.
[Figure 2 here]
A comparison of existing dams in Brazilian Amazonia is instructive as an indication of the relative merits of Samuel (Table 1). The power density (Watts of installed capacity per m2 of reservoir surface) is a useful overall indicator of environmental impact: the lower the density higher the impact. Average residence time (days the average drop of water remains in the reservoir) is related to water quality: the longer the residence time the lower the water quality, with low concentrations of oxygen and high concentrations of methane. Shallow average depth is likewise an indication of high impact.
[Table 1 here]
It should be remembered that dams in widely separated locations (as in Table 1) are not competing options for the role filled by Samuel as a source of power for Rondônia. However, among proposed hydroelectric projects in Rondônia Samuel compares poorly in terms of cost per kilowatt of installed capacity, as well has having a low power density (Table 2).
[Table 2 here]
While more hydroelectric options in distant locations were not in direct competition with Samuel as a potential solution to supplying power to Rondônia, indirectly they do compete in two ways. First, the option of linking Rondônia to the national power grid and supplying it from more distant generating sites was entirely possible, even though the distances involved represented a greater barrier to the transmission technology that existed at the time of the decision to build Samuel than would be the case today. The second way that potential hydroelectric projects elsewhere compete is by providing the option of investing funds in dams with greater cost effectiveness and lower environmental impacts, and continuing to supply electricity to Rondônia from oil-burning thermoelectric plants. The situation facing decision makers at the time Samuel was initiated was similar to the case of the decision to build Balbina instead of (or in addition to) the larger but more distant Cachoeira Porteira Dam (Fearnside 1989a). In both cases, consideration was not given to the option of using oil generation as a bridge to supply power until a more attractive power source could be developed.
The present paper examines the political context in which the decision was made to construct the Samuel Dam, its monetary, environmental and social costs and benefits, and mitigating measures. The case of Samuel highlights the existence of multiple impediments to decision making proceeding in accord with the logical sequence of steps where costs and benefits are estimated and compared prior to making a decision on implanting the project and the decision is made in the best interests of the area’s residents and their descendents. Whether or not Samuel was a worthy project, the decision-making process offers important lessons for pending hydroelectric developments in Rondônia and in many locations throughout Amazonia and the World.
Decision-Making
Political
Context of the Decision
When construction began on Samuel in 1982, Brazil was still ruled by a military dictatorship that restricted public discussion of such subjects. However, an “abertura” (opening) had been in progress since 1979 in preparation for an orderly transition to democracy, and Rondônia figured prominently in the plans of military leaders for achieving this transition while maintaining their influence over the country’s government. Rondônia was a federal territory traditionally administered by the Army, while the other two Amazonian territories were traditionally administered by the other military branches (Roraima by the Air Force and Amapá by the Navy). Jorge Teixeira, the military-appointed governor of Rondônia, was an Army colonel, and was fully engaged in preparing Rondônia for statehood. The World Bank’s POLONOROESTE project was a key part of this strategy: paving the BR-364 Highway and encouraging migration to Rondônia provided political justification for the National Congress to approve creation of a new state, while the almost complete dependence of the recent arrivals on government largesse for providing land, access roads, agricultural financing and other services made the settlers likely to vote for candidates of the political party supported by the military (the Social Democratic Party: PDS). The agreement reached for granting statehood in 1984 created the new state (thereby gaining three seats in the Senate, as well as additional seats in the Chamber of Deputies), while allowing the appointed governor to remain in office for an additional four years without having to stand for election (e.g., Isto É 1984).
At the time of Rondônia’s drive to achieve statehood the minister of the interior was Mario Andreazza, whose ability to implant massive public works had been amply demonstrated by his role in building the Transamazon Highway in 1970 (see Fearnside 1986a). Statehood for Rondônia was an important goal for Andreazza, who hoped to be chosen as president of Brazil through the indirect electoral collage that continued to choose Brazilian presidents through 1984. Andreazza had been preparing his candidacy through promotion of public works ever since the 1960s, when, in his travels as minister of transportation, he perceived the lasting popularity that public works had brought to former president Jucelino Kubitcheck (Branco 1984). Building the Samuel Dam, in addition to the BR-364 Highway, was an essential part of this strategy. The influence of key individuals on the decision process must be recognized: as the head of the World Bank’s Latin America and Caribbean division (Robert Skillings) remarked at the time with respect to the Bank’s approval of POLONOROESTE, it was “hard to say ‘no’ to Andreazza.”
Jorge Teixeira (the military-appointed governor of Rondônia) was also a man whose personality influenced the course of history in the region. His ability to get things done was much appreciated at the World Bank, where he was known as the only man who had ever convinced the Bank to finance a cemetery (in this case when he was mayor of Manaus, prior to being appointed governor of Rondônia). A former volunteer paratrooper in the Vietnam War, his style was seen as ideal for taming the social chaos of Rondônia, which has often been compared to the 19th Century “wild west” of the United States. His tireless promotion of the development of Rondônia undoubtedly helped convince decision makers both in Brasília and in the multilateral development banks to invest in Rondônia, including the Samuel Dam, beyond what would be justified solely on the basis of financial, social and environmental costs and benefits.
Environmental
Impact Assessment
The Samuel Dam was under construction before the Environmental Impact Study (EIA) and Report of Impact on the Environment (RIMA) became mandatory in Brazil on 23 January 1986. Public hearings, also instituted in 1986, were also not required for projects already under construction. Nevertheless, ELETRONORTE contracted a series of environmental studies (to be discussed later). While the grandfather clause exempting Samuel from the EIA and RIMA requirements was always emphasized at the time, it is curious that, years later, the websites of both ELETRONORTE (Brazil, ELETRONORTE nd [2003]) and the consulting firm responsible for the environmental studies (Sondotecnica nd [2003]) refer to these studies as the first EIA/RIMA for an ELETRONORTE dam.
One key aspect of the decision to build
Samuel for which no consideration is known to have been given is an assessment
of alternative means of energy supply, as
well as any re-assessment over the lengthy planning and construction process as
the available options changed. For
example, should there have been a transmission line from Cuiabá, connecting
with the national grid? The technology of long-distance power
transmission improved markedly in the years over which Samuel was under
construction (Pires and Vaccari 1986). Did
the existence of the Samuel project remove the impetus to build such a line and
provide a larger source of power to this part of Amazonia? Another development over the period of
construction was the 1986 discovery of gas in Urucú, two years before the
Samuel reservoir began to fill. Current
infrastructure plans include both a gas pipeline to Urucú and a transmission
line to Cuiabá, as well as additional dams, meaning that the environmental
impacts of all of these projects may be provoked in addition to those already caused by the Samuel Dam.
The
Role of Research
The role of research at Samuel became a
public issue in 1986 when an advisory report on the matter by Brazil’s National
Council for Scientific and Technological Development (CNPq) was leaked to the
press. The report, authored by Zeli Kacowicz, accused Brazil’s National
Institute for Research in the Amazon (INPA) of producing “aseptic reports ...
that don’t even scratch the surface of predicting the environmental impacts of
the construction of [hydroelectric] plants..”, and concluded that the
uncritical reports were due to “the necessity of INPA having to sign an
agreement with ELETRONORTE in order to, from the paltry resources passed to it
by the company [ELETRONORTE], have enough operating capital to pay its bills
for electricity, water and telephones” (Kacowicz 1985; Jornal do Comércio 1986a).
Herbert O. R. Schubart, INPA director at the time the report was leaked
(but not at the time the 1980 contract was signed for INPA’s work in Samuel),
while objecting to the report’s “alarmist” tone, confirmed the basic facts of
the report and stated that “in truth, in a period of crisis, ELETRONORTE used
INPA’s name to protect itself from criticisms that were being made by the
community” (Jornal do Comércio
1986b).
The arrangement whereby INPA collected raw data, which were then used as the basis of reports drafted by a consulting firm, had the result of facilitating uncritical reports while still giving ELETRONORTE the advantage of making use of INPA’s name to bolster the project’s credibility. As at Balbina and Tucuruí, confidentiality clauses in the contract allowed ELETRONORTE to veto publication or public presentation of any inconvenient results (Fearnside 1989a, 2001a). This combination is a formula for the problems divulged in the “Kacowitz Report” on the Samuel Dam research.
Despite improvements in the environmental impact assessment system, the relevance of INPA’s experience at Samuel to environmental studies of contemporary infrastructure projects is evident. The impact studies for the Tocantins-Araguaia Waterway (FADESP 1996a,b), carried out by the Federal University of Pará (UFPa), have been the subject of ongoing criticisms and legal contestation (Switkes 2002; see Fearnside 2001b). The criticisms of UFPa’s reports and financial dependency on consulting contracts are almost identical those made in the “Kacowicz Report” on INPA’s work at Samuel a decade earlier.
The
Role of the World Bank
Before
construction on Samuel began and almost a decade before it was completed,
Robert Goodland (1980), then head of the World Bank’s miniscule (three-person)
environment unit, had singled out Samuel as an example of a dam with
extraordinarily high environmental impact relative to the power it would
generate. However, environmental matters
carried relatively little weight in World Bank decisions at the time, and
Goodland was the only professional ecologist on the Bank’s staff, in contrast
to some 3000 economists.
Samuel
was closely associated with the World Bank-financed POLONOROESTE project, known in Bank parlance as the “Northwest Brazil
Development Pole” (World Bank 1981). The
project reconstructed and paved the BR-364 Highway in 1982, deliberately
opening Rondônia to a flood of migrants from the state of Paraná. This ranks as one of the World Bank’s
greatest environmental embarrassments, and led directly to the creation of the
Environment Department within the World Bank in May 1987 (Holden 1987), less
than 48 hours after an exposé of the project was aired on the 60-minutes
television program in the United States.
POLONOROESTE caused a great increase in deforestation and severe impacts
on indigenous peoples (Fearnside 1986b, 1987a,b, 1989b, Schwartzman 1986). In announcing the creation of the Environment
Department, World Bank president Barber Conable described POLONOROESTE as “a
sobering example of an environmentally sound effort which went wrong” (Holden
1987).
While Samuel was under construction, World Bank guilt for POLONOROESTE was apparent,
and the PLANAFLORO project was financed in an attempt to undo some of the
damage from the earlier loan. Samuel
would not have been needed were it not for the flood of migrants brought by
POLONOROESTE, leading to anguished discussions at the Bank over Samuel and its
impacts. All of the state of Rondônia is
considered to be in the area of influence of POLONOROESTE.
Although
Samuel was not financed as a separate World-Bank “project,” in mid-1986 the
World Bank approved a US$500 million “sector loan” to supply imported equipment
for the entire electrical power sector of Brazil (e.g., Schwartzman and Melone 1987).
Unlike “project loans,” individual projects within the sector are not
subject to environmental review in the case of sector loans, thereby allowing
funds from the World Bank to be used at Samuel.
Context of Energy Development in Rondônia
Electricity Demand
Electricity is fundamental to modern life, both for residential use and for most activities that provide employment. Urbanization is intimately tied to electricity, with urban areas providing much more universal access to electricity to residents and attracting more electricity-demanding commercial and industrial users. The availability of residential electricity, and the possibility of the employment in urban economic activities that depend on electricity, are two of the primary reasons for movement of population from rural to urban areas. In the 1970s and 1980s, Rondônia was one of the most rapidly urbanizing areas in Brazil; the population of Porto Velho grew at 7.64%/year from 1970 to 1991, more than quadrupling over this period (Browder and Godfrey 1997, p. 127). Electricity use in Rondônia was growing explosively prior to the decision to build Samuel, having grown form 5.8 GWh in 1970 to 145 GWh in 1980 (Machado and Souza 2003, p. 218). The precarious electricity supply from diesel generators was recognized as a fundamental limitation on Rondônia’s development (World Bank 1981). Irregular electricity supply was one of the most frequent complaints of sawmill owners at the time (personal observation). A succession of industries in Rondônia has been implanted to process forest and agricultural products in Rondônia, at least as long as the productive resources last. Timber was a major product in frontier areas throughout Rondônia (Browder 1986), although sawmills abandon each successive area as the supply of valuable wood is exhausted. Cassiterite (tin) mining was important in the 1980s when the price of tin was much higher than it is today. In some of the already settled areas, milk production has become an important industry that depends on local processing (Faminow 1998). Soybean farming, a land use that is currently expanding rapidly, is still primarily dependent on processing outside of the state (Fearnside 2001b).
The social benefits of Samuel are significant, in that the power is all consumed locally (Browder and Godfrey 1997, pp. 326-329). This contrasts with dams such as Tucuruí, where most of the electricity generated is used by multinational aluminum companies. The industrial activities in Rondônia have also been relatively energy sparing, at least when compared with intensive uses like aluminum smelting. The social context of energy development in Rondônia may change radically in the near future if plans go forward to turn the state into a major exporter of energy to the rest of Brazil.
Planned Electricity Generation
Jí-Paraná River dams
The Samuel Dam’s small generating capacity made the need for other sources of electric power obvious from the inception of the planning process for Samuel. Plans were laid for the Ji-Paraná Dam on Rondônia's Ji-Paraná (Machado) River at one of three sites selected for dams on that river. The Ji-Paraná Dam would create a 957 km2 reservoir (Brazil, ELETRONORTE 1987), and would flood 107 km2 (6%) of the Lourdes Indigenous Reserve of the Gavião and Arara tribes, plus 37.7 km2 (1.4%) of the Jaru Biological Reserve (Brazil, ELETROBRÁS 1986, p. 6.23). Some of the earlier plans had called for flooding as much as 60% of this reserve (Brazil, ELETRONORTE 1987). Because the World Bank financed these reserves under the POLONOROESTE program, lending funds to finance their flooding under a proposed loan for building the Ji-Paraná Dam was described as “pure folly” by the US executive director of the World Bank in an unsuccessful attempt to block approval of the first Brazilian power sector loan in 1986 (Foster 1986). Preparations for the Ji-Paraná Dam were halted in 1989, supposedly because generation of power from natural gas was just about to begin. It now appears unlikely that the Ji-Paraná Dam will be built because the real estate cost would be too high, given that the land that would be flooded is almost all in a settlement area. However, reactivation of preparations for building this dam has recently been recommended in a report sponsored by the World Bank-funded PLANAFLORO project (Bartholo Jr. and Bursztyn 1999, pp. 160-164). This report also recommends resuming the viability studies for the other two dams identified on the Jí-Paraná River.
Madeira River dams
The Madeira
River, although only a tributary to the Amazon, is one of the World’s great
rivers, with a water flow equal to that of the Yangzi River in China. In the
320-km stretch between Guajará-Mirim and Porto Velho the river drops 60 m in
elevation, with an average flow of 20,000 m3/s. This creates the opportunity for large
hydroelectric dams, despite the problem posed by the Madeira River’s
extraordinarily high sediment loads.
A pre-inventory report was completed for a dam at either Cachoeira Teotônio or the adjacent Cachoeira Santo Antônio (the preferred site is now Cachoeira Santo Antônio), 25 km southwest of Porto Velho. Several plans were made, ranging from 1000 to 8000 MW. The dam foreseen in the 2010 Plan would have 3800 MW (Brazil, ELETROBRÁS 1987). The larger designs include flooding into Bolivia, while the smaller ones only flood in Brazil.
Dams on the Madeira River were seldom mentioned until 1997 and 1998, when the “Úmidas” plan was prepared in with support from the PLANAFLORO project, to suggest directions for Rondônia’s development through 2020. Embedded in a lengthy discussion of sustainable development, the plan’s most concrete proposal was to make Rondônia into an exporter of electricity to central-south Brazil (Bartholo Jr. and Bursztyn 1999, pp. 160-164). A key part of this would be to accelerate work on determining the feasibility of dams on the Madeira River, especially the Santo Antônio Dam [8o, 48’ 52.4” S, 63o 53’ 41.3” S]. Other recommendations were to expand the planned gas-powered thermal plant in Porto Velho using natural gas from Urucú, resume studies for hydroelectric dams on the Ji-Paraná River, with a suggested division of the fall into more dams than the currently planned three (with a total of 1295 MW of installed capacity), and tap the 241 MW of inventoried potential for small hydroelectric dams represented by 64 such dams in Rondônia for which preliminary studies were done by ELETROBRÁS/ELETRONORTE. In addition to exporting power to São Paulo, the plan suggests attracting industries to Rondônia. The Úmidas project is endorsed by the Rondônia state government and by parts of the federal government. It is waiting for a financer.
During Brazil’s “big blackout” (apagão) in 2001, with electricity rationing in effect in most of the country, plans for dams on the Madeira River suddenly became prominent in the National Council for Energy Policy (CNPE). Plans were considered for a 6300 MW configuration for the Santo Antônio Dam and for the 4200 MW Jirau Dam [9o 15’ 47.9” S, 64o 43’ 52.4” W] further upstream (Corrêa 2001).
In March 2003 the government announced plans by Furnas Centrais Elétricas and the Odebrecht construction firm for dams on the Madeira River (Jornal do Brasil 2003). The installed capacities of the dams were revised downward to 3580 MW for the Santo Antônio Dam (of which 2185 would be firm power) and 3900 MW for the Jirau Dam (of which 2285 would be firm power); construction would begin in June 2005 and generation would begin in 2009 and reach completion in 2012 (Machado 2003). Reservoirs would be relatively small: 138 and 110 km2, respectively (Machado 2003). The cost would be US$4 billion, not counting a transmission line linking the dams to the national grid (Quintella 2003). An additional dam in Bolivia (presumably the planned 1500 MW Esperanza Dam on the Beni River [10o 35’11.5” S, 65o 35’ 53.4” W]) would be needed to bring installed capacity to 11,000 MW (Monteiro 2003).
Flooding the rapids on the Madeira River and opening the stretch to barge traffic, expected to carry 50 million tons of soybeans annually, is a major argument for the dams (Machado 2003). Facilitation of soybean transport implies forest losses in both Brazil and northern Bolivia (Fearnside 2001b). A key attraction of the plan is also that it circumvents the regulatory barriers that currently impede two other energy projects due to judicial orders requiring substantial improvements in the environmental impact assessments: the Urucú-Porto Velho gas pipeline (A Crítica 2003) and the Belo Monte Dam on the Xingu River (Pinto 2002). The Madeira dams would both provide an alternative to the pipeline for supplying Rondônia with electricity and contribute hydroelectric energy to the national grid on a scale that planners had expected to obtain quickly from Belo Monte.
Gas pipeline
Generation
of electricity with gas from Urucu, located 500 km NW of Porto Velho, is a top
priority under the Avança Brasil program (Consórcio Brasiliana 1998). This
program includes the 2000-2003 Pluriannual Plan, in addition to an indicative
planning horizon to the end of 2007.
Avança Brasil planned for investment of US$43 billion in Amazonia, of
which US$20 billion would be for infrastructure with direct environmental impacts
(see: Carvalho and others 2001, Fearnside 2002a, Laurance and others 2001). The present government’s 2004-2007 Pluriannual
Plan includes the same projects announced under Avança Brasil. The pipeline is
likely to result in substantial increases in deforestation, since migrants
could be expected follow the access roads (Laurance and others 2001, Fearnside
2002a, Gawora 1998). The gas pipeline would provide access to the last large
block of undisturbed forest in Brazil’s Amazon Region, as deforestation has so
far been almost entirely excluded from the portion of the State of Amazonas
west of the Madeira River.
Costs of
Samuel
Direct Monetary Costs
The Samuel Dam was budgeted at US$835.97
million (Lobato 1993). Construction
began in March 1982, and ELETRONORTE
expected to have all 5 turbines installed by 1990. Successive delays due to budget restrictions
undoubtedly increased the actual costs.
The first turbine was installed on 24 July 1989 and the last on 2 August
1996.
A variety of problems emerged during the construction process, requiring additional expenses. One was the appearance of “canalicos,” or small channels or cavities formed by termites in the earth under the dam (Jury 1989). The problem was solved by construction of an upstream blanket of concrete to lengthen the percolation path (Cadman 1989). The problem of “canalicos” also occurred at Tucuruí.
No figures have ever been released for the final cost of the dam and its transmission lines. Under the optimistic assumption that the dam cost the originally budgeted US$835.97 million, cost was US$3870 per kilowatt installed or approximately the same as at Balbina, which is also on a small river in a flat region inappropriate for hydroelectric development (Fearnside 1989a). Considering a round figure of US$1 billion for the construction cost at Balbina, that dam cost was US$4000 per kilowatt of installed capacity. For comparison, Tucuruí cost US$675/kilowatt and Itaipú US$1206/kilowatt (Veja 1987, p. 30).
As at
Balbina and Tucuruí, a special steel was used in the turbines, adding to
construction costs but avoiding expensive repairs of corrosion that the acid
water causes with more commonly used steels.
The special steel was used because the Curuá-Una Dam had suffered major
repairs and lost generating time because of corrosion of the turbines (Brazil,
ELETROBRÁS/CEPEL 1983). Samuel has had
no problems with corrosion of turbines.
Opportunity
Costs
The cost of a dam is usually stated in terms of the money spent to build the infrastructure and carry out necessary preparatory tasks such as viability studies and resettlement. However, the opportunity cost of sacrificing the land use that would have occupied the site had it not been used for a reservoir should also be part of the decision when a dam-building project is initiated. In this case, the area was covered by tropical forest, which has substantial unrewarded value for its environmental services, in addition to its value as a source of material products (Fearnside 1999b, 2000). However, Samuel was located in one of the areas with the highest rates of deforestation anywhere on Earth; at the time construction began in 1982 the population of Rondônia was growing exponentially at 16% per year and deforested areas were expanding at over 29% per year (both values refer to the 1975-1985 period; see Fearnside 1989b, p. 8), corresponding to doubling times of only 4.3 and 2.4 years, respectively. Today, had the area not been used for a reservoir, it would probably be a landscape dominated by degraded cattle pasture, as in the neighboring settlement areas. The opportunity cost of forest loss could therefore be considered to be much less at Samuel than in cases like Balbina, where forest was flooded in an area that would almost certainly not have been cleared in the absence of the dam. However, the migrants who would have settled in the Samuel area probably found land elsewhere in Rondônia or in other Amazonian states, where they probably cleared approximately the same amount of forest. Viewed in this way, the full area of forest flooded by Samuel must be considered as a cost.
An opportunity cost of money also applies to decisions of this type. Samuel was an expensive means of supplying energy to Rondônia, and encouraging population migration to Rondônia was an expensive choice as a response to the social problems caused by mechanization of agriculture and consolidation of land holdings in Paraná (Fearnside 1986c, 1987a). Money might have been used in other ways, creating greater social benefits. In addition to monetary expenses, the environmental cost of using Rondônia as a safety valve for the land-tenure problems of Paraná was also tremendous.
The inefficient use of money contributes indirectly to one of Amazonia’s greatest problems: stimulation of deforestation for land speculation. During the 1980s while Samuel was being built, investors speculated massively in land purchases as a means of turning Brazil's astronomical inflation to their advantage (a motivation for deforestation that decreased in relative importance from 1994 onwards after the Plano Real economic package slowed the rate of inflation). This inflation was, in part, fueled by ill-conceived projects that injected cash into the economy without producing a corresponding flow of products for consumers to buy with the money. Examples include inefficient dams and marginally-productive ranches in Amazonia. Speculators deforest in the land they buy as a means of protecting it from loss to invading squatters or to government expropriation for agrarian reform; they plant cattle pasture which, despite its low productivity, is the cheapest means of occupying a large area (Fearnside 1993).
Environmental
Costs
Forest
Loss
The Samuel Dam has 0.40 Watts of installed capacity per m2 of reservoir area (Table 1), as compared to the average for the 100 × 103 km2 of dams planned of 1 Watt/m2, also a very low value (Rosa and others 1996, p. 134). At the best dam sites in the region the power density can exceed 10 Watts/m2, but values this high are often misleading because they fail to include the impacts of less-favorable upstream dams used to regulate streamflow and increase the installed capacity that can be used effectively (Fearnside 1996).
Some confusion exists over the correct area of the Samuel reservoir. According to the staff at the dam, the reservoir area is 540 km2 at the normal operating level of 87 m above msl. ELETRONORTE publications prior to filling the reservoir gave the area at this elevation as 645 km2, while a LANDSAT measurement by INPE from 1989 images indicated 465 km2 (see Fearnside 1995, p. 11). However, the reservoir only finished filling in July 1989, and difficulty in distinguishing dry land from moribund forest in shallow water may account for the difference. The 540-km2 area at the 87-m water level will be used in the present paper. The area at the maximum water level of 87.4 m is 586 km2, and at the historic minimum of 72 m it is 135 km2 (based on adjusted areas from Brazil, ELETRONORTE nd [C. 1987]).
At Samuel, 420 km2 of forest was lost, after deducting from the reservoir’s 540-km2 total area the 29-km2 riverbed area (calculated from Brazil, ELETRONORTE nd [C. 1986], see Fearnside 1995, p. 11) and 91 km2 of previous clearing (Fearnside 1995, p. 11). Because the reservoir is in a relatively flat area, 57 km of dikes were built to confine the lateral expansion of the reservoir and thereby increase the head that could be generated without flooding a still larger area.
Original plans would have resulted in further forest loss, as they called for construction of a second dam upstream of Samuel at Monte Cristo, 8 km downstream of the town of Ariquemes (Brazil, ELETRONORTE. nd [C. 1985]). Regulation of the river’s flow by this additional 243 km2 reservoir would increase the firm power at Samuel from 60 to 70 MW, and the two dams together would have a combined firm power of 95 MW. However, the advanced state of settlement in the Ariquemes area now makes it unlikely that expropriating the land for the Monte Cristo reservoir would be politically feasible.
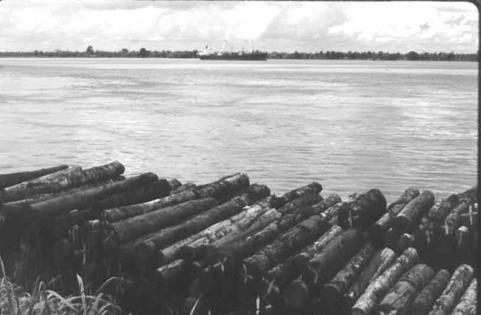
Logging
loophole
Since 1965, Brazil has prohibited the export of raw logs, thereby forcing logging companies to at least do a minimal amount of the sawing in Brazil and contribute to creating employment. However, a special exception was opened in this prohibition to allow logs from Samuel to be exported (Nogueira 1988). From 1987 through 1989 a continuous chain of barges arrived in the port of Itacoatiara with logs for loading on ships, and one ship loaded with logs departed every two weeks (Figure 3).
[Figure
3 here]
Sedimentation
Silt from mining of cassiterite (tin ore) is a large source of sediments in the drainage basins affected. One negative effect of the increase could be more rapid sedimentation of the Samuel reservoir. One mining operation (Mineração Oriente Novo, owned by the Paranapanema mining group) released large amounts of sediment into the Rio Preto (a tributary in the Samuel catchment) until it was stopped in 1986 by a federal court order. Other operations in the Samuel catchment, such as the BRASCAN mines, store their fines behind small retaining dams. Cassiterite mining is now minimal due to the low price of tin.
Soil
erosion is another major source of sediments (Graham 1986). Since much of the catchment is settlement
areas, deforestation for agriculture and ranching is widespread, resulting in
greater soil loss. A study of sediments
in Paca Lake (on the Jamari River 6 km upstream from its confluence with the
Madeira) used 210Pb chronological techniques to demonstrate an
order-of-magnitude increase in sedimentation rates since 1961 due to soil
erosion in settlement areas and cassiterite mining (Forsberg and others 1989).
Aquatic
Ecosystems
Aquatic ecosystems in the section of the river now occupied by the reservoir were completely altered. The river’s sinuous course wound 255 km through the reservoir, now 134 km long, or 122 km in a straight line. Conversion of a running-water (lotic) system to a still-water (lentic) one inevitably involves loss of many species of fish and other organisms, and relative increases in the abundance of others. This is especially true when, as in the case of a reservoir like Samuel, water at the bottom of the reservoir is anoxic over much of the year. Samuel has an average turnover time of 0.4 years (Rosa and others 1997, p. 44); this is an unusually long period for the average drop of water to remain in the reservoir, and is more than twice the 0.14 year turnover time of Tucuruí (which is also considered long). Upstream of the Samuel reservoir the interruption of the annual fish migration (the “piracema” or spawning run) can be expected to alter the composition of species inhabiting the river. Prior to closing the dam, 86 fish species were collected in the area in March and April 1986 (dos Santos 1986). The Jamari River proper has 186 species of plankton out of a total of 210 in the Jamari basin (Mera 1985, pp. 6, 9).
Most of the fish and fishing are in the upper reaches of the reservoir. The reservoir as a whole does not have many fish, although it did have an explosion of some fish populations in the early years. Existence of the BR-364 Highway along one bank of the reservoir makes unauthorized fishing easy. A fishermen’s cooperative was founded but later disbanded.
The town of Itapoã do Oeste is pressing ELETRONORTE to stock fish in the Samuel reservoir (de Oliveira 2001). However, stocking is often inefficient as a means of fish production because, unlike aquaculture in small ponds, most of the fingerlings released in a reservoir are never recaptured. The same investment in promoting aquaculture could result in greater fish production.
As in other Amazonian reservoirs, the population of macrophytes (water weeds) exploded in the early years. ELETRONORTE measured the macrophyte areas in 1996 and 1997, but decided that macrophyte areas since then have not been large enough to justify continuing the measurements. LANDSAT satellite measurements of macrophyte areas (in the dry season) indicate 48% of the reservoir surface covered in 1989, falling exponentially to 0.08% in 1998 (de Lima 2002, p. 47). The main floating macrophytes are Salvinia, Eichhornia and Oricularia (the last of which is an indicator of low-fertility water). In the shallow areas a rooted weed known as “poligano” (in the family Poliganaceae) is common.
For downstream ecosystems, lowering of the oxygen content of the water is the change with the greatest effect. Water use at Samuel is the worst possible for downstream water quality, as virtually all water is passed through the turbines (the spillway has not been used since 1996). Fortunately, there were not many riverside residents along the downstream stretch, settlement being limited to isolated families. The stretch of river below the dam that is entirely dependent on water released by Samuel is relatively short, as the Rio Candeias comes into the Jamari 42 km downstream. Water quality therefore improves below this point. The Rio Candeias, with an average flow of 315 m3/s (April 1976-March 1996: Brazil, ANEEL nd [C. 1999]), or 90% of the Jamari’s flow, is a big enough river to substantially improve water quality, at least in the months when flow is high (i.e., except for August-November). In addition, one very small river, the Rio Novo enters the Jamari 3 km downstream of Samuel.
Water
Table
Stress in trees bordering the reservoir is visible on LANDSAT images, where the false colors of the area around the reservoir indicate a swath of vegetation that is neither the healthy forest nor the dead trees in the reservoir proper. Water table alteration is the most likely explanation. Raising of the water table is also one of the main complaints of the nearby town of Itapoã do Oeste, where streets become mud holes and where a series of canals has been built in an attempt to drain the excess water (de Oliveira 2001).
Greenhouse-Gas
Emissions
Greenhouse-gas
emissions come from carbon dioxide released by decay of dead trees that project
above the water surface in the reservoir, and from methane produced by decay
under anoxic conditions at the bottom of the reservoir (Fearnside 2002b,
2004). Some methane is released by the
reservoir surface through bubbling and diffusion, but much larger amounts are
released from water as it emerges from the turbines or from the spillway. Most of the carbon in the methane comes from
decomposition of soft plant material, such as macrophytes and the green
vegetation that grows in the drawdown zone when exposed and is regularly
flooded when the water level subsequently rises.
Parameters for calculation of greenhouse-gas emissions are given in Table 3. Emissions are estimated in Table 4 for 1990 (the base year for national inventories of greenhouse gases under the United Nations Framework Convention on Climate Change), and for 2000 (after emissions had adjusted to levels that are likely to remain stable over the long term). In 1990, Samuel emitted 11.6 times more greenhouse gases than would have been emitted from oil; in subsequent years these emissions declined, but remained 2.6 times greater than the fossil-fuel alternative in 2000.
[Tables 3 & 4 here]
Social Costs
Resettlement
A total of 238 families were resettled from within the submergence area (Munasinghe 1988, p. 5). The 50 km of the BR-364 highway that was flooded represented the main source of this population displacement (Brazil, ELETRONORTE nd [2003]). Those displaced from the reservoir area were moved to the Rio Preto do Candeias project (Brazil, ELETRONORTE nd [C. 1989]). Of the family heads, 10% had a declared occupation as rubber tappers (Brazil, ELETRONORTE 1990, p. 43).
In addition, 20 families from Cachoeira de Samuel (the dam site, which was a bathing place for weekend visitors from Porto Velho) were moved in 1984 to Vila Candeias on the BR-364 Highway roadside 20 km from Porto Velho. Six years later, these families had either disappeared or were no longer distinguishable as a community (Brazil, ELETRONORTE 1990).
Formation of the reservoir cut off road transportation to part of a settlement area established by the National Institute for Colonization and Agrarian Reform (INCRA). ELETRONORTE has provided a ferry service linking this area to the road system, but the service has been unreliable and is a point of friction between ELETRONORTE and the surrounding population (de Oliveira 2001).
Indigenous
Peoples
No
indigenous people were flooded by Samuel.
However, the dam may have caused impacts on the Uru-Eu-Uau-Uau tribe,
which inhabits the headwaters of the Jamari River, by cutting off fish
migration and by contributing to the attraction of additional population to
Rondônia, further increasing pressure on indigenous areas (Leonel 1987, p.
30). Proximity to the Karitiána
indigenous area was considered a threat to the Karipúna tribe, which had a
population of only 175 individuals (Koifman 2001, p. 417).
Health Impacts
Mosquitoes
Creation of a reservoir like Samuel can provide breeding places for disease vectors such as the anopheline mosquitoes that transmit malaria. Samuel is located between Ariquemes and Porto Velho, which are known for having the highest incidences of malaria in the World (Almeida and Rodrigues 1996, Ellis and others 1988). Although the very high incidence of malaria has been a feature of this area since long before the construction of Samuel, the presence of the reservoir probably exacerbates the situation. At the dam site, up to 21.8 anopheline bites were counted per person per hour (March 1987), with monthly means up to 9.0 bites/person/hour (Tadei 1987, p. 6).
In addition to anopheline mosquitoes, Samuel resulted in an explosion of mosquitoes of the genus Culex (Luz 1994). For example, in September 2001 the swarms of these mosquitoes over the reservoir were so dense that they forced suspension of early-morning data collection on methane emissions (de Lima 2002, p. 43). Culex can transmit filaria (elephantiasis), but the parasite has not yet appeared in Rondônia; it is present in French Guiana and Surinam and may eventually spread to Brazilian Amazonia.
Mercury contamination
One of
the impacts of hydroelectric dams in Amazonia is release of mercury from the
soil in its toxic (methyl mercury) form.
Although goldmining is not a problem in the Samuel catchment, the soils
flooded by the reservoir contain mercury from natural sources. This is because Amazonian soils are millions
of years old and have been gradually accumulating mercury from deposition in
rain and dust from volcanic eruptions and other sources around the world. The anoxic conditions at the bottom of a
reservoir provide the environment needed for methylation of mercury, which
increases in concentration by about ten fold with each link in the food chain
from plankton to fish to people who eat the fish. The concentration appears to follow a pattern
of increasing over several years, following by a decrease, but differences
among reservoirs and the limited number of available measurements impede firm
conclusions.
At Samuel,
the only measurements available were done in late 1991 (two years after filling
the reservoir), and indicated a total mercury concentration of 0.33
mg/kg fresh weight of fish in tucunaré (Cichla
ocellaris and C. temensis) (Malm
and others 1995). Tucunaré is a
predatory fish that makes up most of the commercial catch in Amazonian
reservoirs, including Samuel. An
estimated 80% of the total mercury contained in the fish is in the methyl
(poisonous) form (Kashima and others 2001).
The maximum concentration of total mercury in fish considered safe for
human consumption in Brazil was 0.5 mg/kg fresh weight until 1998, when the
criterion was revised upward to 1.0 mg/kg fresh weight. The question of what safe levels should be is
a matter of controversy (Kaiser 2000).
The World Health Organization (WHO 1976) standard of 0.5 mg/kg fresh
weight is based on the assumption that a 70 kg human would consume 60 g fresh
weight of fish per day, but fish consumption of approximately 200 g daily by
those who live beside Amazonian rivers and reservoirs indicates that the levels
of mercury in fish would have to be much lower [approximately 0.15 mg/kg fresh
weight] to meet the same safety standard (Weisser 2001, p. 5). This is not to say that riverside residents
should forego eating fish, as the negative impacts of poor nutrition could
outweigh those of the mercury (Cleary 1996).
High levels of mercury in fish were found at the Tucuruí Dam, where total mercury in reached 1.1 mg/kg fresh weight of fish in tucunaré six years after the reservoir was filled (Porvari 1995). However, a measurement made 16 years after filling the Tucuruí reservoir found a mean of 0.3 mg/kg fresh weight in tucunaré (Santos and others 2001). The decline in mercury concentration at Tucuruí is considered a matter of good luck, as some reservoirs can maintain high levels for up to 30 years (Olaf Malm, personal communication 2003).
The mercury in fish is reflected in concentrations in the hair of people who eat them, as in the case of the high concentrations at Tucuruí six years after filling (Leino and Lodenius 1995). A unique data set at the Balbina reservoir allows tracking of the history of mercury contamination there over time. Changes in the concentration of mercury in women’s hair were dated by sectioning hair samples from long-haired women, revealing that mercury levels were low before flooding the reservoir, followed by an abrupt rise with reservoir filling, and a drop after concentration reached a peak 11.2 years after filling the reservoir (Weisser 2001, p. 37). The drop may have been caused by a decline in the concentration in the fish, and by the confounding effect of the fish catch from the reservoir having diminished as a result of declining fertility of the water, forcing the residents to eat chicken, pond-raised fish and beef rather than fish from the reservoir (Bruce R. Forsberg, personal communication 2001). At Balbina, the concentration of total mercury in tucunaré was approximately 0.34 mg/kg fresh weight in 1996, 8.4 years after filling the reservoir (Kehrig and others 1998). This is a weighted average methylmercury concentration between the two species of tucunaré in 17 specimens is 0.27 mg/kg fresh weight (Kehrig and others 1998). This methylmercury concentration is equivalent to 0.31 mg/kg fresh weight of total mercury if methylmercury is assumed to be 80% of total mercury (Kashima and others 2001). The hair sample series at Balbina indicates a doubling of mercury concentrations in the hair of fish-eating women between the year of the measurement in fish (1996) and the peak concentration in hair in 1999 (Weisser 2001, p. 37). Comparisons among studies and reservoirs are complicated by a significant positive correlation between the length of a fish and the mercury concentration in its flesh in Tucunaré (Weisser 2001). Mercury levels in tucunaré in Balbina more than doubled between 1992 and 1997 for fish of any given length (Weisser 2001, p. 44). A rise and drop in mercury contamination similar to that at Balbina is likely to have occurred at Samuel, but time-series data for Samuel are unavailable.
Mitigating
Measures
Forest
Reserve
The presence of the Samuel Dam offered the opportunity for creation of a protected area by the federal government’s Special Secretariat of the Environment (SEMA), which has since been incorporated into the Brazilian Institute for the Environment and Renewable Natural Resources (IBAMA). Paulo Nogueira Neto, who directed SEMA, was a master at capitalizing on opportunities to create protected areas, as exemplified by the ecological station he created at Samuel (Fearnside 2003). The Samuel Ecological Station was created on the edge of the reservoir in 1989. Approximately 4700 ha of the 20,854 ha area was flooded (Brazil, ELETRONORTE 1990, p. 60). In 2002, ecological stations were re-designated as “ecological reserves” under Brazil’s new National System of Conservation Areas (SNUC).
Faunal
Rescue
A
faunal rescue operation carried out as the reservoir was filling attempted to
collect animals stranded in treetops and relocate them to nearby forested areas
such as the forest reserve associated with Samuel (de Sá 1992). Of 16,000
animals rescued, 2854 were released in the reserve, while the remainder were
either sent to research institutions (11,417) or sacrificed for museum
collections or research (1,729). Release
of the animals, in truth, does not reduce the death toll to animals because the
individuals placed in forests elsewhere enter into competition with individuals
that are already there, and the population as a whole soon reverts to the level
before the introductions (see Gribel 1993). At Samuel, primate biomass in
the adjacent ecological reserve was estimated at 154 ± 65 kg/km2 in
1988 prior to filling the reservoir, increasing to 255 kg/km2 in
1990, and returning to 153 ± 81 kg/km2 in 1991 (de Sá 1995). Bird biomass in the reserve also increased
when flooding occurred, followed by a decline from 1990 onwards. Similar patterns were seen with agoutis (Dasyprocta fuliginosa) and brocket deer
(Mazama spp) (de Sá 1995).
An
unusual amount of information on wildlife and the effect of the faunal rescue
program is available for Samuel, thanks to the efforts of Rosa de Sá, who
walked 1224 km of transects in the 1989-1991 period to survey mammal and bird
populations in the reserve adjacent to the reservoir and in a control area in
forest downstream of the dam (de Sá 1995).
While recognizing the improvements that ELETRONORTE made in its
procedures since the faunal rescue five years earlier at Tucuruí, the study
indicates that the basic problem of the approach, namely that it is ineffective
and very expensive as a conservation measure, remains fundamentally
unchanged. At Tucuruí, all animals
captured were released near the reservoir, where their survival was problematic
not only because of competition with the animal populations already inhabiting
the forests at the release points but also because these forests were rapidly
being cleared (there were no protected areas).
At Samuel, many of the animals captured were donated to research
institutions rather than being released (a practice initiated at Balbina), and
the creation of a protected area adjacent to the reservoir was an important
improvement. At Tucuruí, the rescue
operation cost UD$30 million, or US$134.80 per animal rescued (about half of
which were arthropods); the cost was US$280 per individual if only birds and
mammals are considered (Johns 1986 cited by de Sá 1995, p. 7). Cost figures have not been released for the
rescue operation at Samuel, but the fact that it is very expensive is
inescapable. In the words of de Sá
(1995, p. 110), “rescue operations have become a public relations strategy used
by power companies to appease public opinion.”
From
the point of view of maintaining biodiversity, investment in protecting
existing forests would have much greater return than faunal rescue operations
of this type, but this kind of investment has a lower public-relations value to
the companies. The recommendations of de
Sá (1995, pp. 110-111) are that rescue operations be confined to species
falling into one or more of the following categories: 1.) species classified as
“endangered” or “vulnerable,” either by the World Conservation Union (IUCN) or
by other criteria [at Samuel species classified as vulnerable by IUCN included
giant anteaters (Mirmecophaga tridactyla),
giant armadillos (Priodontes maximus),
and spider monkeys (Ateles paniscus)],
2.) species unable to escape flooding, 3.) species that could be used for
research (such as snakes, scorpions and spiders from Samuel that were used for
development or production of vaccines and other medicines), and 4.) species
that could be used to re-establish depleted populations elsewhere. Animals should only be released in areas that
have been previously studied and found to have depleted populations (as through
hunting). Other investments, such as
creation of conservation units and investment in professional conservation
staff, must receive priority over the brief but photogenic activity of capturing
and releasing wildlife.
Conclusions:
The Lessons of Samuel
The Samuel Dam illustrates a variety of aspects of the decision-making process that have impeded the choice of development options based on a prior evaluation of costs and benefits, including environmental and social consequences. Making a rational decision on whether a given development project should be implemented depends on an accurate and unbiased assessment of both sides of this balance. The Samuel Dam has significant environmental and social costs, but also real benefits. Some significant impacts were unforeseen due to limited knowledge at the time of the decision to build Samuel, especially in the cases of greenhouse-gas emissions and mercury contamination. The political role of the dam meant that the timing of decisions was incompatible with the logical sequence whereby information is collected on the various options, comparisons are made, and finally a decision is reached.
Assessment of alternatives was almost completely lacking in the case of Samuel. Among these alternatives was the possibility of awaiting a more definitive solution to energy supply for Rondônia, since the capacity of Samuel was soon overwhelmed by demand anyway. The dam illustrates the dilemma of whether to meet demand in a strictly incremental fashion, even when the options (like Samuel) identified by this approach are both financially expensive and of high impact relative to their benefits, or if temporary solutions (such as thermal generation) should be used until more attractive long-term options can be implanted. These options included supplying Rondônia through a transmission link to Brazil’s national grid, exploitation of natural gas deposits in the neighboring state of Amazonas, and larger dams elsewhere in Rondônia. Of course, these options also have impacts that would need to be compared, but the possibility of transmission from the national grid would be especially favorable because the transmission line route through Rondônia and Mato Grosso is already deforested. Samuel illustrates the need for flexibility if the balance of environmental impacts and project benefits changes significantly during the course of planning and construction, in this case due to improvement of long-distance power transmission technology and the discovery of natural gas. Many of the impacts of Samuel apply to planned hydroelectric dams elsewhere in Amazonia and in other tropical areas, and many of the decision-making challenges posed by the dam are applicable to development projects throughout the World.
Acknowledgments
The
National Council of Scientific and Technological Development (CNPq AI
523980/96-5; 350230/97-98; 465819/00-1; 470765/01-1) and the National Institute for Research in the
Amazon (INPA PPI 5-3150; 1-3160) provided financial support. I thank the ELETRONORTE staff at Samuel for
their patience during my visits in 1987, 1995 and 2001. Reinaldo I. Barbosa and two anonymous
reviewers made useful comments on the manuscript. I also thank the late Darrell Posey, who
accompanied me at Samuel in 1995 and encouraged me to write this paper.
Literature Cited
Almeida,
A., and J. Rodrigues. 1996. Rondônia ecológica. Isto É [São Paulo], 31 January 1996, Pages 90-95.
Bartholo Jr., R.S.,
and M. Bursztyn. 1999. Amazônia
Sustentável: Estratégia de Desenvolvimento Rondônia 2020. Instituto
Brasileiro do Meio Ambiente e dos Recursos Naturais Renováveis (IBAMA),
Brasília, DF, Brazil, 247 pp.
Branco, C. C. 1984. No caminho do Planalto: Transformada em questão civil,
a sucessão põe Andreazza e Maluf, crias de Costa e Silva, contra Tancredo
Neves, o contraparente de Getúlio Vargas. Isto
É [São Paulo]. 8 August 1984, Pages 18-19.
Brazil,
ANEEL. 2001. Mapa. http://www.aneel.gov.br/defaultmapa.html. Agência Nacional de Energia Elétrica
(ANEEL), Brasília, DF, Brazil.
Brazil,
ANEEL. 2003. Agência Nacional de Energia Elétrica. http://www.aneel.gov.br. Agência
Nacional de Energia Elétrica (ANEEL), Brasília, DF, Brazil.
Brazil,
ANEEL. nd [C. 1999]. Sistemas
Georeferenciados de Interesse dos Setores de Energia e Hidrologia. Bacia 1.
Sistema de Estatísticas e Informações Hidrológicas (SIH), Agência Nacional de
Energia Elétrica (ANEEL), Brasília, DF, Brazil. (CD ROM).
Brazil, ELETROBRÁS. 1986.
Plano diretor para proteção e melhoria do meio ambiente nas obras e serviços do
setor elétrico. ELETROBRÁS, Diretoria de Planejamento e Engenharia,
Departamento de Recursos Energéticos. Brasília, DF, Brazil. (mimeographed).
Irregular pagination.
Brazil, ELETROBRÁS. 1987. Plano 2010:
Relatório Geral. Plano Nacional de Energia Elétrica 1987/2010 (Dezembro de
1987). Centrais Elétricas do Brasil (ELETROBRÁS), Brasília, DF, Brazil, 269 pp.
Brazil, ELETROBRÁS. 1993. Plano
Nacional de Energia Elétrica 1993-2015: Plano 2015. Centrais Elétricas do
Brasil (ELETROBRÁS), Brasília, DF, Brazil.
Brazil, ELETROBRÁS/CEPEL.
1983. Relatório Técnico Final No. 963/83: Estudo Comparativo de Manutenção nas
Usinas de Curuá-Una e Moxotó. ELETROBRÁS/Centro de Pesquisas de Energia
Elétrica (CEPEL), Brasília, DF, Brazil, 48 pp.
Brazil, ELETRONORTE. 1987.
UHE Ji-Paraná. Maio-87. Centrais Elétricas do Norte do Brasil S.A. (ELETRONORTE), Brasília, DF, Brazil, 8 pp.
Brazil, ELETRONORTE. 1990. Estação Ecológica de Samuel: Plano de Manejo.
Departamento de Estudos de Efeitos Ambientais, Divisão de Ambiente Terrestre, Centrais Elétricas
do Norte do Brazil S.A. (ELETRONORTE),
Brasília, DF, Brazil, 126 pp.
Brazil,
ELETRONORTE. nd [C. 1985]. UHE
Samuel. Centrais Elétricas do Norte do Brasil S.A. (ELETRONORTE), Brasília, DF,
Brazil, 15 pp.
Brazil,
ELETRONORTE. nd [C. 1986].
Reservatório da UHE Samuel: Levantamento Planimêtrico. Centrais Elétricas do
Norte do Brasil S.A. (ELETRONORTE), Brasília, DF, Brazil. Map scale: 1:40,000.
Brazil,
ELETRONORTE. nd [C. 1987]. UHE
Samuel. Centrais Elétricas do Norte do Brasil S.A. (ELETRONORTE), Brasília, DF,
Brazil, 22 pp.
Brazil, ELETRONORTE nd [C. 1989]. Enchimento do reservatório:
Usina Hidrelétrica de Samuel-Rondônia. Centrais
Elétricas do Norte do Brasil S.A. (ELETRONORTE), Brasília, DF, Brazil. 16 pp.
Brazil, ELETRONORTE.
nd [2003]. Usina Hidrelétrica Samuel. http://www.eln.gov.br/meiosam1.htm.
Centrais Elétricas do Norte do Brazil S.A. (ELETRONORTE), Brasília, DF, Brazil.
Brazil,
Furnas 2004. Usina de Manso - 210 MW. WEBFURNAS - Furnas Centrais
Elétricas S.A. http://www.furnas.com.br/
Browder, J. O. 1986. Logging the Rainforest: A Political Economy
of Timber Extraction and Unequal Exchange in the Brazilian Amazon. Ph.D.
dissertation in city and regional planning, University of Pennsylvania,
Philadelphia. 393 pp.
Browder, J. O., and B. J. Godfrey.
1997. Rainforest Cities: Urbanization,
Development, and Globalization of the Brazilian Amazon. Columbia University
Press, New York. 429 pp.
Cadman, J. D. 1989. Energy from the
Amazon. Civil Engineering December
1989:54-57.
Carvalho, G., A. C. Barros, P. Moutinho, and D. C.
Nepstad. 2001. Sensitive development could protect Amazonia
instead of destroying it. Nature 409:131.
Cleary, D. 1996. Mercury contamination and health risk in the Brazilian
Amazon: An ethical dilemma. Revista do Instituto de Medicina Tropical de São Paulo 38:247-248.
Coalição Rios Vivos.
1999. Barragens no Rio Tocantins. http://www.riosvivos.org.br/materia.php?mat_id=177
Consórcio Brasiliana.
1998. Programa Brasil em Ação: Eixos Nacionais de Integração e
Desenvolvimento. Banco Nacional de Desenvolvimento Econômico e Social
(BNDES) PBA/CN-01/97. Relatório Final do Marco Inicial, Consórcio Brasiliana,
Brasília, DF, Brazil, 3 vols.
Corrêa,
M. 2001. “A aposta agora é na Amazônia: Inventário feito pelo governo indica
que se concentra no Norte 43% do potencial energético.” Gazeta Mercantil [Brasília] 20 July 2001, p. A-4.
A Crítica [Manaus].
2003. “MPF vê entraves para o gasoduto.” 19 March 2003 http://www.acritica.com.br/noticias/detalhe.asp?var_materia_id=85571.
da Rosa, S. L., and Z. Cardoso. 1993. Estado de
Tocantins: Aportes para um desenvolvimento harmônico e autosustentado. OCTA
Consultaria e Planejamento S/C Ltda., São Paulo, Brazil. 8 pp.
de Lima, I. B. T. 2002. Emissão
de metano em reservatórios hidrelétricos amazônicos através de leis de potência.
Ph.D dissertation in nuclear energy, Centro de Energia Nuclear na Agricultura
(CENA), Universidade de São Paulo, Piracicaba, São Paulo, Brazil, 108 pp.
de
Oliveira, R. J. M. 2001. Movimento Contra as Agressões Sócio-Ambientais da
UHE/Samuel “Projeto Reparar”: Os peixes pedem passagem—os homens também.
Prefeitura Municipal de Itapuã do Oeste, Itapuã do Oeste, Rondônia, Brazil, Irregular
pagination.
de Sá,
R. M. L. 1992. A view of
hydroelectric dams in the Amazon, with emphasis on the Samuel Dam,
Rondônia. TCD Newsletter 25:1-4. [Tropical Conservation and Development
Program, University of Florida, Gainesville, Florida].
de Sá, R. M. L. 1995. Effects of the
Samuel Hydroelectric Dam on Mammal and Bird Communities in a Heterogeneous
Amazonian Lowland Forest. Ph.D.
dissertation in Forest Resources and Conservation, University of Florida, Gainesville,
Florida, 140 pp.
dos Santos, G. M. 1986. Estudos de Ecologia e Controle Ambiental na
Região do Reservatório da UHE Samuel, Convênio ELN/CNPq/INPA de 01.07.82.
Relatório Setorial, Segmento Estimativa da Ictiofauna. Período Jan/Junho, 1986.
Instituto Nacional de Pesquisas da Amazônia (INPA), Manaus, Amazonas, Brazil,
38 pp.
Ellis, W. S., W. A. Allard, and L. McIntyre. 1988. Rondônia’s settlers invade
Brazil’s imperiled rain forest. National
Geographic December 1988:722-799.
FADESP
(Fundação de Amparo e Desenvolvimento da Pesquisa). 1996a. Relatório de Estudos de Impacto Ambiental - EIA, referente ao projeto
de implantação da Hidrovia dos rios Tocantins, Araguaia e Mortes. FADESP,
Universidade Federal do Pará (UFPA), Belém, Pará, Brazil, 7 vols.
FADESP (Fundação de Amparo e Desenvolvimento da Pesquisa). 1996b. Relatório de Estudos de Impacto Ambiental - EIA, referente ao projeto de implantação da Hidrovia dos rios Tocantins, Araguaia e das Mortes. FADESP, Universidade Federal do Pará (UFPA), Belém, Pará, Brazil. 109 pp.
Faminow, M. D.
1998. Cattle, Deforestation and
Development in the Amazon: An Economic and Environmental Perspective. CAB
International, New York, 253 pp.
Fearnside,
P. M. 1986a. Human Carrying Capacity of
the Brazilian Rainforest. Columbia University Press, New York, 293 pp.
Fearnside, P. M. 1986b. Settlement in Rondônia and the token role of science and technology in Brazil's Amazonian development planning. Interciencia 11:229-236.
Fearnside, P.
M. 1986c. Spatial concentration of deforestation in the Brazilian Amazon. Ambio 15:72-79.
Fearnside, P. M. 1987a. Deforestation and international economic development projects in Brazilian Amazonia. Conservation Biology 1:214-221.
Fearnside, P. M. 1987b. Causes of Deforestation in the Brazilian Amazon. Pages 37-61 in R. F. Dickinson (ed.) The Geophysiology of Amazonia: Vegetation and Climate Interactions. John Wiley & Sons, New York, 526 pp.
Fearnside, P. M.
1989a. Brazil's Balbina Dam: Environment versus the legacy of the pharaohs in
Amazonia. Environmental Management 13:401-423.
Fearnside, P. M. 1989b. A Ocupação
Humana de Rondônia: Impactos, Limites e Planejamento. (CNPq
Relatórios de Pesquisa No. 5). Conselho Nacional de Desenvolvimento Científico e Tecnológico (CNPq), Brasília,
DF, Brazil, 76 pp.
Fearnside, P.
M. 1993. Deforestation in Brazilian Amazonia: The effect of population and land
tenure. Ambio 22:537-545.
Fearnside, P. M.
1995. Hydroelectric dams in the Brazilian Amazon as sources of 'greenhouse'
gases. Environmental Conservation
22:7-19.
Fearnside, P. M. 1996. Hydroelectric dams in Brazilian Amazonia: Response to Rosa, Schaeffer & dos Santos. Environmental Conservation 23(2):105-108.
Fearnside, P.
M. 1999a. Social Impacts of Brazil's Tucuruí Dam. Environmental Management 24:485-495.
Fearnside, P. M. 1999b. Biodiversity as an environmental service in Brazil's Amazonian forests: Risks, value and conservation. Environmental Conservation 26:305-321.
Fearnside, P.
M. 2000. Environmental services as a strategy for sustainable
development in rural Amazonia. Pages 154-185 in C. Cavalcanti (ed.) The Environment, Sustainable Development and
Public Policies: Sustainability in Brazil. Edward Elgar, Cheltenham, UK, 219 pp.
Fearnside, P. M. 2001a. Environmental impacts of Brazil's Tucuruí Dam: Unlearned lessons for hydroelectric development in Amazonia. Environmental Management 27:377-396.
Fearnside, P. M. 2001b. Soybean cultivation as a threat to the environment in Brazil. Environmental Conservation 28:23-38.
Fearnside, P. M. 2002a. Avança Brasil: Environmental and social consequences of Brazil’s planned infrastructure in Amazonia. Environmental Management 30:748-763.
Fearnside, P. M. 2002b. Greenhouse gas emissions from a hydroelectric reservoir (Brazil’s
Tucuruí Dam) and the energy policy implications. Water, Air and Soil Pollution 133:69-96.
Fearnside, P. M. 2003. Conservation policy in Brazilian Amazonia: Understanding the dilemmas. World Development 31(5):757-779.
Fearnside, P. M. 2004. Greenhouse gas emissions from hydroelectric dams: Controversies provide a springboard for rethinking a supposedly “clean” energy source. Climatic Change (in press).
Fearnside, P.
M., and R. I. Barbosa. 1996. Political benefits as barriers to assessment of
environmental costs in Brazil's Amazonian development planning: The example of
the Jatapu Dam in Roraima. Environmental
Management 20(5):615-630.
Forsberg, B., J. M. Godoy, R.
Victoria, and L. A. Martinelli. 1989. Development and erosion in the Brazilian
Amazon: A geochronological case study. GeoJournal
19:402-405.
Foster, H. 1986. Statement by Hugh W.
Foster, U.S. Alternative Executive Director to the Board of Executive
Directors. Brazil: Electric Power Sector Loan. Written statement to the World
Bank Board of Executive Directors dated 19 June 1986. 4 Pages (Reproduced in: Information Packet: Brazilian Power Sector
Loan, Environmental Defense Fund, Washington, DC).
Galy-Lacaux, C., R.
Delmas, C. Jambert, J.-F. Dumestre, L. Labroue, S. Richard, and P. Gosse. 1997.
Gaseous emissions and oxygen consumption in hydroelectric dams: A case study in
French Guyana. Global Biogeochemical
Cycles 11:471-483.
Galy-Lacaux, C., R.
Delmas, J. Kouadio, S. Richard, and P. Gosse. 1999. Long-term greenhouse gas
emissions from hydroelectric reservoirs in tropical forest regions. Global Biogeochemical Cycles
13(2):503-517.
Gawora,
D. 1998. Produção de petróleo e de gás natural no Estado do Amazonas: Projeto
Petrobrás de gás natural de Urucú. Lateinamerika
Dokumentionsstelle Brasilien, Universität Gesamthochschule Kassel, Kassel,
Germany, 23 pp.
Gazeta Mercantil
[Brasília]. 2001.“Energia: MP fixa prazos para licenças ambientais.” 15 May
2001. (http://www.gazetamercantil.com.br).
Goodland, R. J. A. 1980. Environmental
ranking of Amazonian development projects in Brazil. Environmental Conservation 7:9-26.
Graham, D. H. Jr.
1986. The Samuel Dam: Land Use, Soil Erosion, and Sedimentation in
Amazonia. Masters thesis in
geography, University of Florida, Gainesville, Florida, 75 pp.
Gribel, R. 1993. Os mamíferos silvestres e as grandes barragens na Amazônia. Pages
125-140 in E.J.G. Ferreira, G. M.
Santos, E. L. M. Leão, and L. A. Oliveira (eds.) Bases Científicas para Estratégias de Preservação e Desenvolvimento da
Amazônia, Vol. 2. Instituto Nacional de Pesquisas da Amazônia (INPA),
Manaus, Amazonas, Brazil, 435 pp.
Holden, C. 1987. World Bank launches new
environment policy. Science 236:769.
Isto É. [São Paulo]. 1984.
“Truques sem futuro: Constituinte e ministros são temperos para tomar palatável
a prorrogação de Figueiredo.” 16 May 1984, Pages 14-17.
Johns, A. D. 1986. Effects of Habitat Disturbance on Rainforest Wildlife in Brazilian Amazonia. Final Report. World Wildlife Fund U.S., Washington, DC.
Jornal do
Brasil [Rio de Janeiro]. 2003.
“Novas usinas serão licitadas.” 10 March 2003. http://jbonline.terra.com.br/papel/economia/2003/03/10/joreco20030310008.html
Jornal do Comércio [Manaus]. 1986a. “Em defesa do INPA”. 1 April 1986, p. 2.
Jornal do Comércio [Manaus]. 1986b. “Schubart acha parecer sobre o Inpa alarmista.” 1 April 1986, Page 13.
Junk, W. J., and J. A. S. de Mello. 1987. Impactos
ecológicos das represas hidrelétricas na bacia amazônica brasileira. Pages 367-385
in G. Kohlhepp, and A. Schrader (eds.) Homem
e Natureza na Amazônia. Tübinger Geographische Studien 95 (Tübinger
Beiträge zur Geographischen Lateinamerika-Forschung 3). Geographisches Institut, Universität
Tübingen, Tübingen, Germany, 507 pp.
Jury, W. J. 1989. Considerações sobre a ocorrência de canalículos em locais de barragem
na região amazônica.
Masters thesis in geotechnica,Universidade de São Paulo em São Carlos, São
Carlos, São Paulo, Brazil, 74 pp. http://ged.capes.gov.br/AgTest/silverstream/pages/pgRelatorioTesesCompleto.html?ANOBASE=1989&IDPROGRAMA=33002045009P3&SEQUENCIAL=5
Kacowicz, Z. 1985. Convênio ELETRONORTE/CNPq/INPA.
Relatórios semestrais dos projetos “Estudos de ecologia e controle ambiental
nas regiões dos reservatórios UHEs de Balbina e Samuel: Comentários. Conselho
Nacional de Desenvolvimento Científico e Tecnológico (CNPq), Brasília, DF,
Brazil, 3 pp.
Kaiser, J. 2000. Mercury report backs strict rules. Science 289: 371-372.
Kashima, Y.,
H. Akagi, Y. Kinjo, O. Malm, J. R. D. Guimarães, F. Branches, and R. Doi. 2001.
Selenium and mercury concentrations in fish from the lower Tapajos River and
the Balbina Reservoir, Brazilian Amazon.
Page 280 in 6th International Conference on Mercury as a Global
Pollutant (ICMGP). Oct. 15-19, 2001, Minamata, Japan. ICMGP, Minamata, Japan,
392 pp.
Kehring, H. A., O. Malm, H. Akagi, J. R .D. Guimarães, and J. P. M. Torres. 1998. Methylmercury in fish and hair samples from the Balbina Reservoir, Brazilian Amazon. Environmental Research 77:84-90.
Koifman,
S. 2001. Geração e transmissão da energia elétrica:Impacto sobre os povos
indígenas no Brasil. Cadernos da Saúde
Pública 17:314-423.
Laurance, W. F., M. A. Cochrane, S. Bergen, P. M. Fearnside, P. Delamônica, C. Barber, S. D’Angelo, and T. Fernandes. 2001. The Future of the Brazilian Amazon. Science 291:438-439.
Leino, T., and M. Lodenius. 1995. Human hair mercury levels in Tucuruí area, state of Pará, Brazil. The Science of the Total Environment 175:119-125.
Leonel, M. 1987. Contribuição à integração dos componentes ambientais à
avaliação do POLONOROESTE: Hidrelétricas e BR-429. POLONOROESTE, Porto Velho
and Fundação Instituto de Pesquisas Econômicas (FIPE), Rio de Janeiro, RJ,
Brazil, 61 pp.
Lobato,
E. 1993.
"Odebrecht faz maioria das obras do setor elétrico." Folha de São Paulo, 5 May 1993, Page
1-7.
Luz, S. L. B. 1994. Estudo sobre os
culicíneos (diptera: culicidae: culicinae) crepusculares e noturnos, vetores
potenciais de patógenos de importância medica e veterinária na Estação
Ecologica de Samuel - Rondônia. Masters thesis in veterinary medicine, Universidade Federal Rural do Rio
de Janeiro, Seropédica, Rio de Janeiro, Brazil, 94 pp http://ged.capes.gov.br/AgTest/silverstream/pages/pgRelatorioTesesCompleto.html?ANOBASE=1994&IDPROGRAMA=31002013003P3&SEQUENCIAL=20
Machado,
J. A. da C., and R. C. R. Souza. 2003. Fatores determinantes da construção de
hidrelétricas na Amazônia: Bases para a exigência de indenização. Pages 209-251
in L. E. Aragón, and M. Clüsener-Godt (eds.), Problemática do Uso Local e Global da Água da Amazônia. Núcleo de
Altos Estudos Amazônicos (NAEA), Universidade Federal do Pará (UFPA), Belém,
Pará, Brazil. 504 pp.
Machado, O. 2003.
“Hidrelétricas no rio Madeira somarão US$ 4 bilhões em investimentos.” Canal Energia 12 March 2003. http://www.canalenergia.com.br/cenergia/calandra.nsf/0/B0172016E1B04E2203256CE70059B3E8?OpenDocument.
Malm, O. M. B. Castro, W. R. Bastos, F. J. P. Branches, J. R. D.
Guimarães, C. E. Zuffo, and W. C. Pfeiffer. 1995. An assessment of Mercury
pollution in different goldmining areas, Amazon Brazil. The Science of Total Environment 175:127-140.
Mera, P. A. S. 1985. Estudos de
Ecologia e Controle Ambiental na Região do Reservatório da UHE Samuel, Convênio
ELN/CNPq/INPA de 01.07.82. Relatório Semestral, Segmento Zooplancton/Fitoplancton,
Período Julho/Dezembro, 1985. Instituto Nacional de Pesquisas da Amazônia
(INPA), Manaus, Amazonas, Brazil, 157 pp.
Mineração Taboca S/A, and Perfil
S/A. 1990. Estudo de Impacto Ambiental. [UHE Pitinga 2]. Mineração Taboca S/A,
Manaus, Amazonas, Brazil, Irregular
pagination.
![]() Monteiro,
R. R. 2003. “Furnas quer Itaipu
amazônica.” Jornal do Brasil [Rio de
Janeiro]. 12 March 2003. http://jbonline.terra.com.br/papel/economia/2003/03/12/joreco20030312010.html
Monteiro,
R. R. 2003. “Furnas quer Itaipu
amazônica.” Jornal do Brasil [Rio de
Janeiro]. 12 March 2003. http://jbonline.terra.com.br/papel/economia/2003/03/12/joreco20030312010.html
Munasinghe, M. 1988. Brazil: Proposed second power sector loan: Social and environmental aspects: Background note. World Bank. Memorandum dated 19 Sept. 1988 to participants in briefing session on the Brazilian Second Electric Power Sector Loan. [available from Bank Information Center, Washington, DC], 9 pp.
Nogueira,
W. 1988. “China importa madeira em toras” Amazonas
em Tempo, 9 March 1988, Section 1, Page 8.
Pinto, L. F. 2002. “A derrota de Belo Monte.” O Estado de S.Paulo 12 November 2002. http:///www.estadao.com.br.
Pires, F. B., and F. Vaccari. 1986. Alta-tensão por um fio. Ciência Hoje 4(23):49-53.
Porvari, P. 1995. Mercury levels of fish in Tucuruí hydroelectric reservoir and river Mojú in Amazonian, in the state of Pará, Brazil. The Science of the Total Environment 175:109-117.
Quintella,
C. 2003. “Furnas apresenta projeto de hidrelétricas para geração de 7,3 mil
MW.” Jornal do Brasil [Rio de Janeiro],
12 March 2003.
http://jbonline.terra.com.br/pepel/economia/2003/03/12/joreco20030312010.html.
Revilla
Cardenas, J. D. 1986. Estudos de ecologia
e controle ambiental na região do reservatório da UHE de Samuel. Convênio:
ELN/MCT/CNPQ/INPA de 01.07.82. Relatório Setorial, Segmento: Estimativa da
Fitomassa. Período julho-dezembro 1986. Instituto Nacional de Pesquisas da
Amazônia (INPA), Manaus, Amazonas, Brazil, 194 pp.
Revilla
Cardenas, J. D., and I. L. do Amaral. 1986. Estudos de Ecologia e Controle Ambiental
na Região do Reservatório da UHE de Samuel: Convênio ELN/CNPq/INPA, de
01.07.82. Relatório Setorial. Segmento Minhocucus, Período Janeiro/Junho 1986.
Instituto Nacional de Pesquisas da Amazônia (INPA), Manaus, Amazonas, Brazil, 5
pp.
Rosa, L. P., M. A. dos Santos, J. G. Tundisi, and B. M. Sikar. 1997. Measurements of greenhouse gas emissions in
Samuel, Tucuruí and Balbina Dams. Pages 41-55 in L. P. Rosa, and M. A. dos
Santos (eds.), Hydropower Plants and
Greenhouse Gas Emissions. Coordenação dos Programas de Pós-Graduação em Engenharia
da Universidade Federal do Rio de Janeiro (COPPE/UFRJ), Rio de Janeiro, RJ,
Brazil, 111 pp.
Rosa, L. P., R. Schaeffer, and M. A. dos Santos. 1996. Emissões de metano e
dióxido de carbono de hidrelétricas na Amazônia comparadas às termelétricas
equivalentes. Cadernos de Energia No.
9:109-157.
Santos, H. S. B., O. Malm, and H. A. Kehrig. 2001. Mercury contamination
in Cichla temensis (tucunaré) from Tucuruí Reservoir, Brazilian Amazon. Page 136 in 6th International Conference on Mercury as a Global Pollutant
(ICMGP). Oct. 15-19, 2001, Minamata, Japan. ICMGP, Minamata, Japan,
392 pp.
Schimel, D., and 75
others. 1996. Radiative forcing of climate change. Pages 65-131 in J. T.
Houghton, L. G. Meira Filho, B. A. Callander, N. Harris, A. Kattenberg, and K.
Maskell (eds.), Climate Change 1995: The
Science of Climate Change. Cambridge University Press, Cambridge, U.K. 572
pp.
Schwartzman, S.
1986. Bankrolling Disasters:
International Development Banks and the Global Environment. Sierra Club,
Washington, DC, 32 pp.
Schwartzman, S.,
and M. Melone. 1987. The multilateral development banks and the Brazilian
electrical energy sector. Environmental Defense Fund (EDF), Washington, DC, 29
pp. + attachments.
Sondotecnica.
nd [2003]. Usina hidrelétrica
Samuel. http://www.sondotecnica.com.br/ambiente_br.html.
Sondotecnica, SA, Rio de Janeiro, RJ, Brazil.
Switkes, G. 2002. Brazilian government pushes ahead with
plans for huge dam in Amazon. World Rivers Review 17(3):12-13.
Tadei, V. P. 1987. Estudos de Ecologia e Controle Ambiental na
Região do Reservatório da UHE Samuel, Convênio ELN/CNPq/INPA de 13-01-87,
Relatório de Avanço e Acompanhamento Semestral, Segmento Doenças
Endêmicas-Vetores da Malária, Período Janeiro-Julho, 1987. Instituto
Nacional de Pesquisas da Amazônia (INPA), Manaus, Amazonas, Brazil, 28 pp.
Tundisi,
J. G., M. A. Santos, and C. F. S.
Menezes. 2003. Tucuruí reservoir and power plant: Management experience brief. http://www.worldlakes.org/uploads/Tucurui_15Jun03.pdf.
van
de Vate, J. F. 1996. Hydropower:
Potential sources of greenhouse gases. In Assessment
of Greenhouse Gas Emissions from the Full Energy Chain for Hydropower, Nuclear
Power and Other Energy Sources. Papers Presented at an IAEA Advisory Group
Meeting Jointly Organized by Hydro-Québec and the International Atomic Energy
Agency, Hydro-Québec Headquarters, Montréal (Canada) 12-14 March 1996.
International Atomic Energy Agency (IAEA), Geneva, Switzerland. (I1-AG-832.4),
Irregular pagination.
Veja. [São Paulo]. 1987. "Um jogo de faraós e
empreiteiros." 20 May 1987, Pages 28-37.
Weisser,
S. C. 2001. Investigation of the history of mercury
contamination in the Balbina Reservoir, Amazon, Brazil. Masters thesis in environmental toxicology,
Universität Konstanz, Konstanz, Germany, 66 pp.
WHO (World Health Organization).
1976. Environmental Health Criteria 1: Mercury.
WHO, Geneva, Switzerland.
World Bank. 1981. Brazil: Integrated Development of the
Northwest Frontier. Latin American and Caribbean Regional Office,
International Bank for Reconstruction and Development (IBRD), The World Bank,
Washington, DC. 101 pp.
FIGURE LEGENDS
Figure 1 – Brazil’s
Legal Amazon region with locations mentioned in the
text.
Figure 2 –- The
Samuel reservoir and the state of Rondônia.
Figure 3 - Logs on
a barge in Itacoatiara (February 1988) awaiting loading on ships bound for
China. The exception to Brazil’s
prohibition of exporting raw logs opened for logs from the Samuel Reservoir was
reportedly used as cover for export of logs coming from all over western Amazonia.
COVER PHOTOGRAPH
CAPTION
Flooded trees in the Samuel reservoir, Rondônia,
Brazil (March 2001).