The
text that follows is a PREPRINT.
Please cite as:
ISSN:
0378-1127
Copyright:
Elsevier
The original publication is available at: http://www.elsevier.com.nl
Fire
frequency and area burned in the Roraima savannas of Brazilian Amazonia
Reinaldo
Imbrozio Barbosa
INPA/CPEC
(Roraima)
C.P.
96
69301-970
Boa Vista, Roraima
Brazil
+55-(95)-623 9433
Philip Martin Fearnside
INPA/CPEC
C.P.
478
69011-970
Manaus, Amazonas
Brazil
+55-(92)-643 1822
1 July 2004
Abstract
Estimates were made of
the percentage of area burned and the fire frequency in different ecosystems of
non-anthropic savannas located in the north and northeast portions of the State
of Roraima, Brazil. Three years of observations (June 1997 to May 2000)
indicated that the mean percentage of area burned annually, weighted for all
ecosystems, was 38 ± 12 (SD) %. The mean frequency of fire (number of years for
an area to burn again) was 2.5 years. Both parameters are dependent on the type
(structure) of vegetation, the altitude of the savanna and the climatic state
(dry, wet or normal) of the year of the observation. Using values for two-month
periods over the three year time series (n=18), a simple regression model to
forecast percentage area burned was developed for Sg savannas (grassy-woody
savanna; “clean field” and “dirty field” types), using as the independent
variable the daily mean precipitation. The proposed model explains 66% of the
reported cases. These results are the first developed for savannas in the
Amazon region and are directly applicable to calculations of greenhouse-gas
emissions from burning in this ecosystem type.
Keywords: Amazonia;
Burned area; Fire frequency; Roraima; Savannas
1. Introduction
Amazonia plays an
important role in the maintenance of the world carbon balance (Fearnside, 1997;
Houghton et al., 2001; Nascimento and Laurance, 2002). Amazonia’s carbon
storage potential gives great importance to land-use changes in this region
because disturbances of the natural landscape can increase atmospheric carbon
and affect global biogeochemical cycles (Seiler and Crutzen, 1980; Houghton et
al., 1983; Greenberg et al., 1984; Crutzen and Andreae, 1990; Houghton, 1990;
Setzer and Pereira, 1991; Fearnside, 1996).
Biomass burning produces significant amounts of trace gases, such as
methane (CH4) and nitrous oxide (N20), which contribute
to global warming and other global atmospheric changes. Net emissions of carbon dioxide (CO2)
can also be affected.
Forest ecosystems
receive the attention of most of the scientific studies conducted in Amazonia
because forests represent the largest landscape in the region. However,
Amazonian savannas represent a significant portion of the area of terrestrial
systems, and, in the same way as the forests, savannas are rapidly being
converted for agriculture and ranching and is exposed to recurrent burning in
thousands of km2 of the remaining original (non-anthropic)
ecosystems. This transforms the savanna ecosystems into an important
terrestrial source of greenhouse gases (Seiler and Crutzen, 1980; Ward et al.,
1992; McNaughton et al., 1998; Hoffa et al., 1999).
Of the studies that
have been done on a large scale in Brazil on emission of gases by savannas,
most are limited to evaluations of the savannas of the country’s center-west
region, close to the area known as the “Arc of Deforestation” (Barbosa, 2001).
Of these, only two studies (Schroeder and Winjum, 1995; Fearnside, 1997) attempted to estimate the potential emission
of this Brazilian ecosystem despite the high uncertainty or outright lack of
values for some of the parameters needed for the calculations, such as the
extent of the area burned annually and the frequency of the passage of the
fire. These two factors are important in calculations of the storage and
release of carbon in savanna areas (IPCC/OECD, 1994).
Acceleration of burning
frequency can result in depletion of carbon and nitrogen stocks in the soil,
eventually leading to reduced grass productivity (Kauffman et al., 1994;
Scholes and Walker, 1993 cited by Sampson et al., 2000, p. 207). Burn frequency has increased in the cerrado
areas of Brazil’s center-west region as a result of more intense management of
these ecosystems for cattle grazing (Coutinho, 1990, pp. 87-88). Climatic changes such as increased frequency
of El Niño events, leading to dry years in Amazonia, could contribute to future
increases in burning frequency.
Due to the almost complete lack of
studies on this subject, most calculations of greenhouse-gas emissions use
unreferenced values (probably guesses) for fire frequency (e.g., Hao et al., 1990), or site a source that leads to one of
these unreferenced values. The values
put forward by Hao et al. (1990), for example, are used in subsequent estimates
(e.g., Scholes and Andreae, 2000) and
as IPCC default values (IPCC, 1996, p. 4.64).
Remote sensing is used to overcome the inherent deficiencies in this
type of calculation. However, the interpretation difficulties associated with
this method are also large because burn scars in savannas are visible for only
a short period (in contrast to burning associated with deforestation),
hindering measurement through remote sensing. It is possible to count the
number of fires (“hot pixels”), but not to estimate the size of the burned area
without an excessive amount of error (Kaufman et al., 1990; Robinson,
1991). Progress has been made in
perfecting sampling methods using the AVHRR sensor with verification of the
precision through LANDSAT-TM and/or SPOT images for determining burned areas in
central-African savannas (Barbosa et al., 1998; Barbosa et al., 1999a; 1999b;
Pereira et al., 1999) and in Brazilian cerrados (Brazil, MCT, 2002 citing Krug
et al., 2001; see also Krug and dos Santos, 2001). However, especially in the case of the
studies used in Brazil’s preliminary inventory of greenhouse gases (Brazil,
MCT, 2002), the number of LANDSAT images associated with the “hot spot” (fire
pixel) data from the AVHRR sensor was
insuficient to estimate area and frequency of burning in the non-anthropic Brazilian
cerrados without an excessive amount of uncertainty. An estimate for a small area of cerrado has
recently been done using LANDSAT imagery by itself, but without a means of
extending the estimate to the cerrado area as a whole (Krug et al., 2004).
The present study has
the objective of estimating the percentage of burned area and the frequency of
burning in non-anthropic Amazonian savannas through on-the-ground sampling
using the primary and secondary highways that cut through the largest block of
continuous savannas of the Brazilian Amazon, located in the State of Roraima.
The study covered “original” ecosystems (non-anthropic remnants), “anthropic”
ecosystems (agriculture and ranching) and “other ecosystems” that are
intermingled with the local savannas (e.g.,
forest islands).
2. Study
area
The study area is
located in the north-northeast area of the State of Roraima, in the
northernmost portion of the Brazilian Amazon – approximately between 2o
30' N and 5o 0' N and 59o 30' W and 61o 30' W
(Figure 1). This landscape is an enormous mosaic of savanna ecosystems that are
a part of the "Rio Branco-Rupununi Complex", which covers parts of
Brazil and Guyana (Eden, 1970; Sarmiento and Monasterio, 1975). Its components
range from low-altitude grasslands (< 100 m) to arborous types at higher
altitudes (> 1000 m). It is the largest continuous block of savannas in the
Amazonian Biome (± 40,000 km2). The climate of this area is Awi
under the Köppen Classification (Lameira and Coimbra, 1988), with 1100-1700 mm
of annual precipitation and 100-130 days with rain per year (Barbosa, 1997).
The driest months are between December and March (± 10% of the annual
precipitation) and the peak of the rainy season is between May and August (±
60% of the annual precipitation). The relief that supports this landscape
increases in altitude as one moves from the center-south to the
north-northeast, beginning at approximately 80-100 m in the area of the Boa
Vista Formation, increasing in the Surumu Formation and remaining in the
250-900-m range as one approaches the high-altitude (> 1000 m) areas of the
Roraima Group (Brazil, Projeto RADAMBRASIL, 1975).
[* * *
Figure 1 here ****]
3.
Ecosystems studied
Characterization of the
ecosystems in this study followed the Brazilian vegetation classification
system (Brazil, IBGE, 1992), together with the definition adopted for Central
Brazilian savannas (Coutinho, 1978; Ribeiro and Walter, 1998). This
characterization is important because the dynamics of fire in each ecosystem is
different, provoking unequal effects in the area burned and in the fire
frequency. The ecosystems (original and transformed) investigated in the
present study are presented in Table 1.
[* * *
Table 1 here ***]
4. Sampling
methodology
4.1.
Sampling Transect
The total area burned annually and
the frequency of burning of each ecosystem were represented through periodic
observations along a triangular sampling transect covering a linear distance of
540.1 km. The transect cuts through all of the vegetation types defined above
(see Figure 1). Nine points formed the basis for alignment of the transect:
Point 0 (initial) - close to the city of Boa Vista in the Rio Branco valley (2o
47' 39" N; 60o 39' 59" W), Point 1 – in the Tacutu-1 River
valley (3o 18' 40" N; 59o 56' 50" W), Point 2 -
in the Tacutu-2 River valley (3o 48' 4" N; 59o 44'
14" W), Point 3 - Raposa/Serra do Sol Indigenous Land (4o 10'
42" N; 60o 31' 36" W), Point 4 – in the Cotingo River
valley (4o 24' 13" N; 60o 20' 57" W), Point 5 –
in the Surumu River valley (4o 11' 38" N; 60o 47' 31"
W), Point 6 - São Marcos Indigenous Land (4o 13' 51" N; 61o
0' 56" W), Point 7 – in the Uraricoera River valley (3o 27'
49" N; 60o 54' 39" W) and Point 8 (endpoint) - city of Boa
Vista in the Cauamé River valley (2o 52' 9" N; 60o
41' 50" W).
In the first passage along the
transect (June-July 1997: rainy season and without burning) we determined and
recorded the limits of each ecosystem (original and transformed) based on the
number of kilometers traveled by the vehicle used during the whole study. The
structural variations among the original systems studied were defined based on
the crown cover of the arboreal individuals (Table 1). Because it would be impractical to measure
each individual along the 540.1-km transect, we classified the savannas based
on our personal experience in visual observation of the general aspect of these
vegetation types. We considered the original savannas to be all of the
landscapes where the visual appearance of the cover was in accord with the
definition of IPCC/OECD (1994), in other words,"... with continuous grass cover, occasionally
interrupted by trees and bushes..." under different densities. Both “other”
and “anthropic” ecosystems were identified within the “savanna” and
“steppe-like savanna” great groups, but burning in these areas was not counted,
as this has been the subject of a separate study (Barbosa and Fearnside, 1999).
With the linear total
(in km) corresponding to each ecosystem, it was possible to infer the burned
area (%) and the frequency of the fire for each ecosystem through the
quantification of the linear kilometers reached annually by the fire. This was
important to avoid the whole area of savannas being considered a block that
suffers the impacts of the fires equally, independent of the climatic type of
the year (normal, dry or humid), the vegetation type or the geographical
location of the site.
4.2. System
of measurement
The transect was driven by car every
60 days in the rainy season and monthly in the dry season, during three years from
June-July 1997 to April-May 2000, totaling 12,962.4 km of transect in 24 trips.
On each trip a log was made of the initial and final number of kilometers
traveled and of the burned areas on each side of the highway. Occasional fires
in small areas along the edge of the highway were discarded and the linear
distances were only used where the landscape had suffered burning over a long
distance, independent of the observer being able to see the entirety of the
portion of the burn that extends away from the road. In this method we assumed
that each side of the highway had independent fire behavior, although there is
a probability of the fire moving across the highway because some burning plant
material is carried by the wind. At the end of each measurement we computed an
average for each vegetation type in each period.
With each passage along the transect
we made a correction of the values recorded for distance, using as a reference
the first sampling done in the rainy period (June-July1997). This was necessary
in order to avoid distortions due to the tires of the vehicle having different
air pressure and different amounts of wear on each trip and because of the
expansion of the tires due to the varying temperatures (environmental and
material) over the course of the sampling period. A test done before the second sampling
demonstrated that these factors could influence the measurement by up to 3 km
over the course of the transect. To lessen this effect, verification points
were established to allow calibrating the measures obtained on each trip. The
number of kilometers traveled was recorded in units of 0.1 km.
4.3.
Treatment of the data
To obtain an overall
average of burned area and of fire frequency for the three years of
observation, as recommended by the IPCC (1997), we used a weighting system
based on the individual average for each year, considered the proportion of
years classified as dry, humid and normal. This took advantage of our
observations in years classed as “El Niño” (1997/1998), “La Niña” (1998/1999)
and “normal” (1999/2000). We used measurements of annual precipitation between
1966 and 1999 at the Meteorological Station of Boa Vista to determine how many
years were below one standard deviation of the mean (dry years), above one
standard deviation (humid years) or within one standard deviation (normal
years). We estimated that the distribution of these climatic characteristics
for the current period would be 18.2% for years considered to be dry, 21.2% for
humid years and 60.6% for normal years. These values represent approximately
the proportions of a normal distribution for data collected systematically
(Zar, 1974, pp. 73-76).
All of the data were
grouped into two-month periods representing climatically similar intervals:
June-July (peak of the rainy season), August-September (end of the rainy
season), October-November (between seasons), December-January (beginning of the
dry season), February-March (peak of the dry season) and April-May (beginning
of the rainy season). This set of two-month periods totaled 18 (n) values
distributed over the three years of data collection. Graphs of the dynamics
were plotted for the burning (% area burned), and the fire frequency was
calculated in each of the ecosystems starting from the overlapping of values
over the sample period. Finally, a simple regression model was derived to
estimate the percentage (%) of burned area in the Sg (clean field + dirty
field) ecosystem, based on precipitation data obtained from the Meteorological
Station of Boa Vista.
5. Results
5.1. Burned
area
The weighted mean
percentage of area burned annually for all the original ecosystems of “savanna”
and “steppe-like savanna” studied in Roraima was 38 ± 12 (SD)% (Table 2). The
absolute values pointed to an accentuated variation in the 1997/1998 (dry)
biennium (53%), in comparison with 1998/1999 (wet) (30%) and 1999/2000 (normal)
(36%). The steppe-like savanna ecosystems (high altitude) had the highest mean
area burned annually (46 ± 21%), followed by the low- and mid-altitude savannas
(35 ± 9%). Individually, the vegetation types with the lowest densities of
trees (grassy-woody) of the steppe-like areas had the largest values for burned
area: Tg–clean field (85 ± 6%) and Tg–dirty field (57 ± 14%). The vegetation
type with the smallest individual value was the type with the highest crown
cover of trees in the areas with low and middle altitudes: Sa (27 ± 17%).
[*
* * * TABLE 2 here*****]
Of the total area burned annually,
90.9% occurred between October and March (October-November = 23.3%;
December-January = 39.1%; February-March = 28.6%). The remainder occurred in
August-September (7.1%) and April-May (2.1%), with June-July having no
incidences of burning (Table 3; Figure 2).
[*
* * * TABLE 3 here****]
[
* * * FIGURE 2 here ****]
5.2.
Frequency of burning
The individual values
for each biennium indicated that almost all of the locations were only reached
by fire once (1997/1998=99.6%; 1998/1999=99.6%; 1999/2000=98.4%) in every
sampled year (Table 4). The recurrence of fires within a given year was 0.4%
(1997/1998), 0.4% (1998/1999) and 1.6% (1999/2000). Of the total area (weighted
average) burned in the three sampled years, 56% burned only once. The remainder
was distributed among the areas that burned two (34.3%), three (9.1%) or four
(0.6%) times. This means that the average interval between one-time fire events
was 1.8 years; the interval between occurrences of two burns in succession was
2.9 years, while three-burn sequences occurred once every 11 years and
four-burn sequences once every 159 years. These values imply that the mean time
of recurrence of fires in a given area for all the original ecosystems studied
was 2.5 years (30 months).
[****TABLE
4 here ****]
On average, 70-80% of the areas
burned in one year are not affected by new fires the following year (Table 5).
Only 20-30% of the burned areas repeat the same place as the previous year.
[****TABLE
5 here ****]
5.3. Burned
area × precipitation (regression model)
Precipitation data from
Boa Vista (1997 to 2000) have a strong association with the percentage of area
burned in the Sg ecosystem (clean field + dirty field), which includes the area
surrounding that city (Figure 3). A
regression model using data from two-month periods explains 66.2% of the
variance in percentage area burned based on the average daily rainfall (mm/day)
in the same two-month period (Figure 4):
Y = 11.801 – 4.254 ln(X)
Where Y = percentage (%) of burned
area in the two-month period and, X = daily mean precipitation for the same
period (mm.day-1)
[* * * *
Figure 3 here ****]
[* * * *
Figure 4 here **** ]
6.
Discussion
6.1. Burned
area
The weighted average of
38% (27-85%) for total percentage area burned annually determined in this study
for Amazon savannas in Roraima is similar to the 40% value used by Seiler and
Crutzen (1980) for savannas worldwide based on the work of Deschler (1974) for
African savanna between 5o N and 12o N and of Fearnside
(1978) for Amazonian pastures. However, the value is much lower than the 75%
suggested by Menaut and Cesar (1982) and used by Hao et al. (1990) and Hall and
Rosillo-Calle (1990) as the average for the African savannas. Later this number
was revised to 50% in Hao and Ward (1993) and Hao and Liu (1994) and used as
the overall average by different authors in the early 1990s for calculating
emissions of gases from biomass burning in savannas in the tropics as a whole.
Although data of Lavenu (1982, 1984), cited by Menaut et al. (1991), reported
more conservative estimates (25-49%) in studies using LANDSAT imagery of the
Sahelian Zone of the Ivory Coast, the 75% value was still used in some studies.
Our study also found some high values for low-biomass ecosystems (e.g., 85% for Tg–clean field). This
serves to reinforce the need to associate the results of burned area with the
respective vegetation types in order to avoid misunderstandings arising from
use of a single value for all savanna ecosystems.
The first attempts to
distribute the estimates among different types of ecosystems were made by
Delmas et al. (1991) and Menaut et al. (1991) in spatial analyses of the total
biomass burned in savannas in Africa (10-70%). Scholes (1995), in an evaluation
of greenhouse-gas emissions in southern Africa, also distributed his evaluation
among vegetation types, ranging from semi-desert (± 0.1%) to humid ecosystems
(± 53%). Recent studies by Barbosa et
al. (1999a,b) and Pereira et al. (1999) used the AVHRR sensor in
central-African savannas to estimate annual averages for different
phytogeographical zones of 19-36% (1981-1991), 3-70% (1985-1987 and 1990-1991)
and 61% (1996) (P. M. Barbosa and J. M. Pereira, personal communication, 2000).
All of these values represent scenarios and assumptions that are still little
studied and that contain large uncertainties due to the scales and the spatial
resolutions used. The results for annual means determined for the savannas of
northeast Roraima are of a magnitude similar to the overall average of the
results of the African studies mentioned above.
In Brazil, no
on-the-ground studies exist that determine the percentage area burned in open
ecosystems. Kauffman et al. (1994) reported an annual estimate of 50% for
Central Brazilian savannas, but the calculation source is not indicated. IPCC
(1997, p. 4.25) uses the same value as the “default” in spreadsheets for
emission calculations for the whole of Tropical America, citing Hao et al.
(1990). The preliminary Brazilian national inventory estimates emissions of
gases from burning in non-anthropic savannas by using LANDSAT-TM imagery
associated with information on “hot pixels” detected by AVHRR (Brazil, MCT,
2002). The MCT study concluded that, of the total area burned in savannas
throughout Brazil in 1999, 8.3% was in clean and dirty field (Sg) types, 14.8%
was savanna parkland (Sp), 66.4% arborous savanna (Sa) and 10.5% was
“cerradões” (Sd). This last type is counted as forest, rather than savanna, in
the reports on land-use change in forest ecosystems (see Brazil, INPE, 2002).
This distribution of burned area done by MCT (Brazil, MCT, 2002) uses the
studies by Krug et al. (2001), considering the concentration of “hot pixels” in
the different ecosystems. However, this method does not address the question of
whether the concentration of “hot pixels” is really a function of the area
burned, of the size of the ecosystem or of the persistence of the hot pixels
(their persistence will be longer or shorter depending on the vegetation
structure and the amount of biomass present).
Recently, Krug et al. (2004) drew inferences about the area burned and
the recurrence of fires in two LANDSAT scenes in the cerrado of central Brazil
using images from LANDSAT-5 TM and LANDSAT-7 ETM for the 1996-2000 period. One can calculate from the results of the
study the total area burned declined from 13.8-15.5% (1996) to 4.4-7.0%
(2000). Although the study has a
reasonably complete sequence of scenes (20 scenes out of a possible 50 (40%)
for a sampling period of 160 days of draught), there are still time gaps that
are sufficient to mask any growth of the vegetation and hide the true spatial
extent to the burning.
Our data from Roraima
indicate that the mean percentage of area burned in two-month periods is
directly related to (1) human presence, (2) spatial heterogeneity of the
biomass, and (3) fire behavior in response to climatic conditions in the year
of the observation. Lamotte and Bruson (1985 [1990]) cited by Menaut et al.
(1991), found that when savanna fires occur at the beginning of the dry season
in the Ivory Coast (December or earlier), they consume up to 12% of the total
biomass affected. At the peak of the dry season this value rises to 75%
(January), subsequently falling to 13% (February onwards) at the end of the
burning season. If one makes assumptions regarding affected biomass and burned
area, the distribution presented by Menaut et al. (1991) can be compared to the
monthly estimate for Roraima, where 90% of the burned area appeared in the peak
months of the dry season. This directly influences the total amount of biomass
affected by fire.
6.2.
Frequency of Burning
The African studies indicate
a period of 1-2 years for recurrence of fires in a given area. The same value
(1.5 years) is presented by Lacey et al. (1982) for Australian savannas and by
Eiten (1972) for central-Brazilian savannas. Coutinho (1990) and Hoffmann
(1998) re-estimated the value as 1-3 years for the Brazilian savannas. Our
field results (2.5 years) are higher than the above-mentioned estimates (Table
6).
[***Table
6 here***]
The areas with the
greatest recurrence of fire in the savannas of Roraima were concentrated close
to the headquarters of the cattle ranches and to indigenous villages that the
transect intersected. Multiple burns were associated with the presence of
humans. Fires that spread from (or occurred near) human settlements had shorter
recurrence periods. This result would be expected because fires are typically
anthropogenic. Burning in other areas along the transect, supposedly without
human interference, would result from fires started by humans located in any
part of the local savannas.
An important finding of
our study is it that most (70-80%) of the areas burned in one year do not burn
in the following year. In other words, there is always a high percentage of new
area being burned in the following period.
Similar to our finding in Roraima, the studies by Krug et al. (2004) in
central Brazil and by Barbosa et al. (1999a) in central-African savannas found
that, respectively, only 16-18% and 9% of the areas burn regularly over time;
the remainder of the burning is in new areas. This result implies that the
dynamics of fire in these areas lead to a variety of scenarios for the amount
of biomass and carbon exposed to burning over time and in different areas. The
amount of biomass present is not a fixed value from one year to the next. The
rates of biomass increment and carbon should be a function of the dynamics of
entrance and exit of material from the ecosystem due to the recurrence of the
fires.
With regard to the number of fires
occurring in a single year, our study found that, of the total of area burned
in a single year, almost all (± 99%) burns only one time. The complete recovery
of the low vegetation, which is the principal fuel, is slow and takes at least
4-5 months in years considered to be humid and 6-7 months in years defined as
normal. Before this interval of time elapses there is a reduced chance of
accumulation of enough biomass to sustain a fire with high intensity and
lingering duration. Cases of double
burning in a single year are rare (± 1%) and, in general, are observed in places
that burned at the end of the dry season of one year, followed by a reburning
at the end of the rainy season in the same year.
6.3. Burned
area × precipitation (regression model)
Figures 3 and 4
indicate that the burning patterns observed in 1997/1998, 1998/1999 and
1999/2000 are explained as a function of rainfall. These results reinforce the
importance of the distribution of the measures of burned area not only for
ecosystems, but also for the different climatic conditions at each study site,
when applied in calculations of emission of gases from savanna burning.
6.4.
Sampling errors
In general, one might
infer that the frequency of fires and the percentage of burned area determined
by the method used in the present study could be biased as a measure for the
area as a whole due to the proximity of highways to all of the fires observed.
This inference could come from the fact that the highways are the starting
points of development projects and ranches, which would change the density of
the vegetation along the highway and make it unrepresentative of the vegetation
in the rest of the savanna. However, the highway acts in the same way as any
random transect and would count both fires that started from the area of
influence of the highways and those that did not. We considered that, under
this sampling alternative, fires are virtually
always started by humans (both indigenous and non-indigenous), but that, once
started, the spreading of the fire is independent of human presence. Therefore,
although the sampling error can be considered high, the mean probably would
tend to fall very close to the means that would be obtained by randomized or
systematic surveys. To test this, we made two overflights (80 and 45 linear km)
in April and May 1998 to identify and correct for the error in the estimate of
the value of terrestrial area in Sg and Sp for the 1997/1998 biennium. The
results of the overflights indicated that the terrestrial transect was able to
detect 65-70% of the burned areas (Barbosa, 2001). This result is approximately
equal to the 70% value estimated by Barbosa et al. (1999) for central African
savannas using remote sensing techniques.
7.
Conclusions
(1) values for burned area and fire frequency in the savannas of Roraima
are dependent of the vegetation types (structures) and the elevational position
(the lower the density of trees and the greater the amount of grassy vegetation
in high-altitude areas, the greater will be the percentage of burned area);
(2) the amount of burned area is directly related to the climatic type
of the year (dry, wet or normal), which can be inferred from precipitation
parameters using simple regression
models;
(3) on average, 38 ± 12% of the area of all of the savannas present in
Roraima burns annually – a value composed of areas that burn only once in the
year (± 99%) and those that burn more than once (± 1%);
(4) the average frequency of burns for the savannas of Roraima is 2.5
years;
(5) most (70-80%) of the area
burned in one year does not burn the following year, implying time differences
in the approach to calculating biomass dynamics and in models that calculate
the emission of greenhouse gases from savannas;
8. References
Barbosa, R.I. 2001. Savanas
da Amazônia: Emissão de gases do efeito estufa e material particulado pela
queima e decomposição da biomassa acima do solo, sem a troca do uso da terra,
em Roraima, Brasil. Doctoral dissertation.
Instituto Nacional de Pesquisas da Amazônia (INPA)/ Universidade do
Amazonas (UA), Manaus, Amazonas, Brazil. 212 pp.
Barbosa, P.M.; Pereira,
J.M.C.; Grégorie, J.M. 1998. Compositing criteria for burned area assessment
using low resolution satellite data. Remote Sensing of Environment, 65:
38-49.
Barbosa, P.M.;
Stroppiana, D.; Grégorie, J.M.; Pereira,J.M.C. 1999a. An assessment of
vegetation fire in Africa (1981-1991): Burned areas, burned biomass, and
atmospheric emissions. Global Biogeochemical Cycles, 13(4): 933-950.
Barbosa, P.M.; Grégorie,
J.M.; Pereira, J.M.C. 1999b. An algorithm for extracting burned areas from
time series of AVHRR GAC data applied at a continental scale. Remote Sensing of
Environment, 69: 253-263.
Barbosa, R.I. 1997.
Distribuição das chuvas em Roraima. In: R. I. Barbosa, E. Ferreira; E. G.
Castellon (eds.), Homem, Ambiente e Ecologia em Roraima. Instituto
Nacional de Pesquisas da Amazônia (INPA), Manaus, Amazonas, Brazil. pp.
325-335.
Barbosa,
R.I.; Fearnside, P.M. 1999. Incêndios na Amazônia brasileira: Estimativa da emissão de gases
do efeito estufa pela queima de diferentes ecossistemas de Roraima na passagem
do Evento “El Niño” (1997/98). Acta Amazonica, 29(4): 513-534.
Brazil, IBGE. 1992. Manual
Técnico da Vegetação Brasileira. Manuais Técnicos em Geociências no
1. Instituto Brasileiro de Geografia e Estatística (IBGE), Rio de Janeiro,
Brazil. 92 pp.
Brazil, INPE 2002. Monitorando
a floresta amazônica brasileira por satélite (2000-2001). Instituto
Nacional de Pesquisas Espaciais (INPE), São José dos Campos, São Paulo, Brazil.
Brazil, MCT. 2002. Emissões de gases do efeito estufa da queima
de biomassa no cerrado não antrópico utilizando dados orbitais (Primeiro
Relatório Brasileiro de Emissões Antrópicas de Gases do Efeito Estufa – Relatório
de Referência). Coordenação Geral de Mudanças Globais, Ministério da Ciência e
Tecnologia (MCT), Brasília, DF, Brazil. 53 pp.
Brazil, Projeto
RADAMBRASIL. 1975. Levantamento de
Recursos Naturais, Volume 8. Ministério das Minas e Energia. Rio de Janeiro,
Brazil. 428 pp.
Coutinho, L.M. 1978. O
conceito de cerrado. Revista. Brasileira de Botânica, 1: 17-23.
Coutinho, L.M. 1990. Fire in the
ecology of the Brazilian cerrado. In:
J. G. Goldammer (ed.), Fire in the Tropical Biota - Ecosystem Processes and
Global Challenges, Springer-Verlag, Berlin,
Germany. pp. 82-105.
Crutzen,
P.J.; Andreae, M.O. 1990. Biomass burning in the tropics: Impact on
atmospheric chemistry and biogeochemical cycles. Science, 250:
1669-1678.
Delmas,
R.A.; Loudjani, P.; Podaire, A.; Menaut, J.C. 1991. Biomass
burning in Africa: An assessment of annually burned biomass. In: J. S. Levine (ed.), Global
Biomass Burning - Atmospheric, Climatic, and Biospheric Implications.
Massachusetts Institute of Technology Press, Cambridge, Massachusetts, U.S.A.
pp. 129-131.
Deschler,
W.W. 1974. An examination of the extent of grass fires in the savanas of Africa
along the southern side of Sahara. In: Ninth International Symposium on
Remote Sensing of Environment, ERIM, Ann Arbor, Michigan, U.S.A.
Eden, M.
1970. Savanna vegetation in the northern Rupununi, Guyana. The Journal of
Tropical Geography, 30: 17-28.
Eiten,G.
1972. The cerrado vegetation of Brazil. Botanical Review, 38: 201-341.
Fearnside, P.M. 1978. Estimation
of Carrying Capacity for Human Populations in a part of the Transamazon Highway
Colonization Area of Brazil. Ph.D. dissertation in biological sciences,
University of Michigan, Ann Arbor. University Microfilms International, Ann
Arbor, Michigan, U.S.A. 624 pp.
Fearnside,
P.M. 1996. Amazonia and global warming: Annual balance of greenhouse gas
emissions from land-use change in Brazil's Amazon region. In: J. S.
Levine (ed.), Biomass Burning and Global Change (vol. 2). Massachusetts
Institute of Technology, Cambridge, Massachusetts, U.S.A. pp. 606-617.
Fearnside,
P.M. 1997. Greenhouse gas emissions from deforestation in Brazilian Amazonia:
Net committed emissions. Climatic Change,
35: 321-360.
Greenberg,
J.P.; Zimmerman, P.R.; Heidt, L.; Pollock, W. 1984. Hydrocarbon and carbon monoxide
emissions from biomass burning in Brazil. Journal of Geophysical Research,
89(D1): 1350-1354.
Hall, D.;
Rosillo-Calle, F. 1990. African forests and grasslands: Sources or sinks of
greenhouse gases ? In: International Conference on Global Warming &
Climate Change: African Perpectives. Nairobi, Kenya (2-4 May). 23 pp.
Hao, W.M.;
Ward, D.E. 1993. Methane production from global biomass burning. Journal of
Geophysical Research, 98(D11): 20657-20661.
Hao, W.M.;
Liu, M.H. 1994. Spatial and temporal distribution of tropical biomass burning. Global
Biogeochemical Cycles, 8(4): 495-503.
Hao, W.M.;
Liu, M.H.; Crutzen, P.J. 1990. Estimates of annual and regional releases of CO2
and other trace gases to the atmosphere from fires in the tropics. Based on the
FAO Statistics for the period 1975-80. In: J. G. Goldammer (ed.),
Fire in the Tropical Biota. Springer-Verlag, Berlin, Germany. pp. 440-462.
Hoffa, E.A.;
Ward, D.E.; Hao, W.M.; Sussot, R.A.; Wakimoto, R.H. 1999. Seasonality of carbon
emissions from biomass burning in a Zambian savanna. Journal of Geophysical
Research, 104(D11): 13841-13853.
Hoffmann,
W.A. 1998. Post-burn reproduction of woody plants in a neotropical savanna: The
relative importance of sexual and vegetative reproduction. Journal of
Applied Ecology, 35: 422-433.
Houghton,
R.A. 1990. The future role of tropical forests in affecting the carbon dioxide
concentration of the atmosphere. Ambio, 19(4): 204-209.
Houghton,
R.A.; Hobbie, J.E.; Melillo, J.M.; Moore, B.; Peterson, B.J.; Shaver, G.R.; Woodwell,
G.M. 1983. Changes in the carbon content of terrestrial Biota and soils between
1860 and 1980: A net release of CO2 to the atmosphere. Ecological
Monographs, 53(3): 235-262.
Houghton,
R.A.; Lawrence, K.T.; Hackler, J.R.; Brown,S. 2001. The spatial distribution of
forest biomass in the Brazilian Amazon: A comparison of estimates. Global Change Biology, 7: 731-746.
IPCC, 1997.
Greenhouse Gas Inventory: Reporting Instructions, Vol. 2. In: J. T.
Houghton; L. G. Meira-Filho; B. Lim; K. Tréanton; I. Mamaty; Y. Bonduki; D. J.
Gribbs; B. A. Callander (eds.), Revised 1996 IPCC Guidelines for National
Greenhouse Gas Inventories. IPCC/OECD/IEA. Geneva, Switzerland. pp.
4.23-4.27.
IPCC/OECD
1994. Greenhouse Gas Inventory Reporting Instructions (Final Draft).
IPCC Draft Guidelines for National Greenhouse Gas Inventories (Vols. 1 – 2 -
3). IPCC/OECD Joint Programme, Geneva, Switzerland.
Kauffman.
J.B.; Cummings, D.L.; Ward, D.E. 1994. Relationships of fire, biomass and
nutrients dynamics along a vegetation gradient in the Brazilian Cerrado. Journal
of Ecology, 82: 519-531.
Kaufman,
Y.J.; Setzer, A.; Justice, C.; Tucker, C.J.; Pereira, M.C.; Fung, I. 1990.
Remote sensing of biomass burning in the tropics. In: J. G. Goldammer
(ed.), Fire in the Tropical Biota, Springer-Verlag, Berlin, Germany. pp.
371-399.
Krug, T.,
Rivera-Lombardi, R.J.; dos Santos, J.R. 2004. Burned area, recurrence of fires
and permanence of burnt scars in selected areas of the Brazilian cerrado using
TM-LANDSAT imagery. In: XX
International Society for Photogrammetry and Remote Sensing Congress, Istambul,
12-23 July 2004. (in press)
Krug, T.; dos Santos,
J.R. 2001. Estimativa da área total
queimada no cerrado brasileiro em 1999, a partir de dados orbitais.
Relatório PNUD BRA/95/G31. São José dos Campos, São Paulo, Brazil.
Krug, T.; dos Santos,
J.R.; Miranda, H. 2001. Estimativa da
área queimada no cerrado brasileiro não-antropizado em 1999, a partir de dados
orbitais. Report to the Coordenação Geral de Mudanças Climáticas, Ministério da
Ciência e Tecnologia (MCT), Brasília, DF, Brazil..
Lacey, C.J.;
Walker, J.; Noble, I.R. 1982. Fire in Australian tropical savannas. In:
B. J. Huntley ; B. H. Walker (eds.), Ecology of Tropical Savannas
(Ecological Studies 42). Springer-Verlag, Berlin. Germany. pp. 246-272.
Lameira, O.A.; Coimbra,
J.M. 1988. Levantamento e distribuição da precipitação em Roraima. Pesquisa
em Andamento no 12. Empresa Brasileira de Pesquisa Agropecuária
(EMBRAPA/UEPAT), Boa Vista, Roraima, Brazil.
Lamotte,
M.; Bruzon, V. 1985 [1990]. Variations saisonnières de la fixation
et de la libération de gaz carbonique dans les milieux de savane de Côte
d'Ivoire . Action des feux de brousse. Paysages, aménagement, cadre de vie.
Mélanges offerts à Gabriel Rougerie. Paris, Publication
de l'Association Française de Géographie Physique et de l'Université Paris
8, Paris, France. pp. 173-186.
Lavenu,
F. 1982. Teledetection des feux de savana dans le Parc National de la Comoe
(Cote-d'Ivore). Dissertation, Université de Paris, Paris, France.
Lavenu,
F. 1984. Teledetection et vegetation tropicale: example du Nord-Est de la
Cote d'Ivore et du Bengladesh. Thesis, Université Provence Sud
(UPS), Toulouse, France.
McNaughton,
S.J.; Stronach, R.H.; Georgiardis, N.J. 1998. Combustion in natural fires and
global emissons budgets. Ecological Applications, 8(2): 464-468.
Menaut, J.C. 1983. The vegetation of African savannas. In: F. Bourlière (ed.) Tropical savannas.
(Ecosystems of the World 13). Elsevier, Amsterdam, the Netherlands. pp. 109-149.
Menaut, J.C.; Abbadie, L. ; Lavenu, F.;
Loudjani, P. ; Podaire, A. 1991. Biomass burning in West African savannas. pp. 133-142 In: J.S.
Levine (ed.) Global Biomass Burning:
Atmospheric, Climatic, and Biospheric Implications. Massachusetts
Institute of Technology Press, Cambridge, Massachusetts, U.S.A. 640 pp.
Menaut,
J.C.; Cesar, J. 1982. The structure and dynamics of a West Africa Savanna. In:
B. J. Huntley ; B. H. Walker (eds.), Ecology of Tropical Savannas (Ecological
Studies 42). Springer-Verlag, Berlin, Germany. pp. 80-100.
Menaut,
J.C.; Abbadie, L.; Lavenu, F.; Loudjani, P.; Podaire, A. 1991. Biomass burning
in West African Savannas. In: J. S. Levine (ed.), Global Biomass
Burning - Atmospheric, Climatic, and Biospheric Implications. Massachusetts
Institute of Technology Press, Cambridge, Massachusetts, U.S.A. pp. 133-142.
Nascimento, H.E.M.;
Laurance, W.F. 2002. Total aboveground biomass in central Amazonian
rainforests: A landscape-scale study. Forest Ecology
and Management, 168: 311-321.
Pereira, J.M.C.; Pereira,
B.S.; Barbosa, P.; Stroppiana, D.; Vasconcelos, M.J.P.; Grégorie, J.M. 1999. Satellite
monitoring of fire in the EXPRESSO study area during the 1996 dry season
experiment: Active fires, burnt area, and atmospheric emissions. Journal of
Geophysical Research, 104 (D23): 30701-30712.
Pivello, V.R.; Coutinho, L.M. 1992. Transfer of
macro-nutrients to the atmosphere during experimental burnings in an open
cerrado (Brazilian savanna). Journal of Tropical
Ecology, 8: 487-497.
Ribeiro,
J.F.; Walter, B.M.T. 1998. Fitofisionomias do Bioma Cerrado. In: Sano, S.M.;
Almeida, S.P. (eds.), Cerrado - Ambiente e Flora. EMBRAPA,
Planaltina, Distrito Federal, Brazil. pp. 89-166.
Robinson, J.M. 1991. Problems in global fire
evaluation: Is remote sensing the solution? pp. 67-73 In: J.S. Levine (ed.) Global Biomass Burning: Atmospheric,
Climatic, and Biospheric Implications. MIT Press, Boston, Massachusetts,
U.S.A. 640 pp.
Sampson,
R.N. and 32 others. 2000. Additional human-induced activities – Article 3.4.
pp. 181-281 In: R.T. Watson, I.R. Noble, B. Bolin, N.H.
Ravindranath, D.J. Verardo; D.J. Dokken (eds.) IPCC Special Report on Land Use, Land-Use Change, and Forestry.
Cambridge University Press, Cambridge, U.K. 377 pp.
Sarmiento,
G.; Monasterio, M. 1975. A critical consideration of the environmenatl
conditions associated with the occurrence of Savanna ecosystems in Tropical
America. In: F. B. Golley ; E. Medina (eds.), Tropical Ecological
Systems: Trends in Terrestrial and Aquatic Research. Springer-Verlag, New
York, U.S.A. pp. 223-250.
Scholes,
R.J. 1995. Greenhouse gas emissions from vegetation fires in Southern Africa. Environmental
Monitoring and Assessment, 38: 169-179.
Scholes, M.;
Andreae, M.O. 2000. Biogenic and pyrogenic emissions from Africa and their
impact on the Global Atmosphere. Ambio, 29(1): 23-29.
Scholes,
R.J.; Walker, B.H. 1993. An african savanna: Synthesis of the Nylsveley study.
Cambridge University Press, Cambridge, U.K. 293 pp.
Schroeder,
P.E.; Winjum, J.K. 1995. Assessing Brazil’s carbon budget: II . Biotic fluxes
and net carbon balance. Forest Ecology and Management, 75: 87-99.
Seiler,
W. ; Crutzen, P.J. 1980. Estimates of gross and net fluxes of carbon between
the biosphere and the atmosphere from biomass burning. Climate Change,
2: 207-247.
Setzer,
A.W.; Pereira, M.C. 1991. Amazonia biomass burnings in 1987 and an estimate of
their tropospheric emissions. Ambio, 20(1): 19-22.
Ward, D.E.; Sussot,
R.A.; Kauffman, J.B.; Babbitt, R.E.; Cummings, D.L.; Dias, B.; Holben, B.N.;
Kaufman, Y.J.; Rasmussen, R.A.; Setzer, A.W. 1992. Smoke and fire
characteristics for Cerrado and deforestation burns in Brazil: BASE-B
Experiment. Journal of Geophysical Research, 97(D13): 14601-14619.
Zar, J.H.
1974. Biostatistical Analysis. Prentice Hall, Englewood Cliffs, New
Jersey, U.S.A. 620 pp.
FIGURE LEGENDS
Figure
1–South America with the location of Roraima and of the savanna area.
Figure
2–Cumulative percentage area burned for “original” savanna ecosystems in
Roraima in years of different climatic types.
Figure
3--Daily precipitation and area burned in two-month periods for Sg savannas
(clean field + dirty field) in Roraima.
Figure
4—Observed versus calculated area burned.
|
Table 1 - Caracterization of the ecosystems studied. |
|
|
|
|
|
|
||
|
|
|
|
|
|
|
|
|
|
|
Macro System (1) |
Ecosystem |
Structural type |
Crown Cover (%) |
Tree stratum (Height) |
Estimated Area (2) (km2) |
Transect length (km) |
|
|
|
|
|
|||||||
|
|
|
|||||||
|
Savanna |
|
|
|
|
|
|
|
|
|
Sg |
grassy-woody |
clean field |
0 |
Absent |
7929 |
177.8 |
|
|
|
Sg |
grassy-woody |
dirty field |
< 5 |
Minimal |
5759 |
129.1 |
|
|
|
Sp |
parkland |
parkland cerrado |
5-20 |
2-4 m |
11350 |
133.2 |
|
|
|
Sa |
arboreous |
typical cerrado |
20-50 |
3-6 m |
547 |
12.5 |
|
|
|
Anthropic S |
- |
(3) |
- |
- |
- |
20.5 |
|
|
|
Others S |
- |
(4) |
- |
- |
- |
31.9 |
|
|
|
Steppe-like savanna |
|
|
|
|
|
|
|
|
|
Tg |
grassy-woody |
clean field |
0 |
Absent |
198 |
1.5 |
|
|
|
Tg |
grassy-woody |
dirty field |
< 5 |
Minimal |
343 |
2.5 |
|
|
|
Tp |
parkland |
parkland cerrado |
5-20 |
2-4 m |
5730 |
19.7 |
|
|
|
Ta |
arboreous |
typical cerrado |
20-50 |
3-6 m |
666 |
10.1 |
|
|
|
Anthropic T |
- |
(3) |
- |
- |
- |
0.5 |
|
|
|
Others T |
- |
(4) |
- |
- |
- |
0.9 |
|
|
|
|
|
|
|
|
|
|
|
|
|
(1) savanna = vegetation situated mainly at altitudes
below 600 m, occupying a mosaic of Ultisol and Oxisol soils; Steppe-like
savanna = vegetation situated mainly at altitudes above 600 m in a mosaic
of litholic soils, including milky quartz. |
|
|
||||||
|
|
|
|||||||
|
|
|
|||||||
|
|
|
|
|
|
|
|
|
|
|
(2) estimate based on phytoplanimetric maps
(1:250,000) in Brazil, Projeto RADAMBRASIL, 1975. |
|
|
|
|||||
|
|
|
|
|
|
|
|
|
|
|
(3) original vegetation modified by human activity
without a reliable estimate of area. |
|
|
|
|
||||
|
|
|
|
|
|
|
|
|
|
|
(4) other original vegetation that does not fit in
the general definition of savannas; included in this category are terrestrial
ecosystems such as forest islands and gallery forests and aquatic ecosystems
such as rivers and lakes. |
|


Table 6 - Burning frequencies in
savannas
Vegetation type
Location Frequency Source
Derivation
of
burning
(years)
EMISSIONS ESTIMATES
All savannas worldwide 2.5 Seiler and Crutzen, 1980, p. 226
Deschler, 1974;
Fearnside, 1978
All savannas worldwide 2.5± 1.5 Crutzen and Andreae, 1990, p.
1670 Menaut, 1991
Cerrado Brazil (central)
1.5 ± 1.5 Hao et al., 1990 Eiten, 1972;
Sarmiento and Monasterio,
1977
African savannas Africa 1.33 Hao
et al., 1990 Menaut and Cesar, 1982;
Menaut, 1983;
J.C.Menaut, personal
communication
to Hao et al., 1990.
SITE STUDIES
Cerrado Brazil (central)
2 Eiten, 1972
Cerrado Brazil (central)
1-3 Coutinho, 1990, pp.
87-88
Cerrado Brazil (central) 3 Pivello and Coutinho, 1992
Roraima Brazil
(northern) 2.5 This study
savanna (lavrado)
Fig. 1
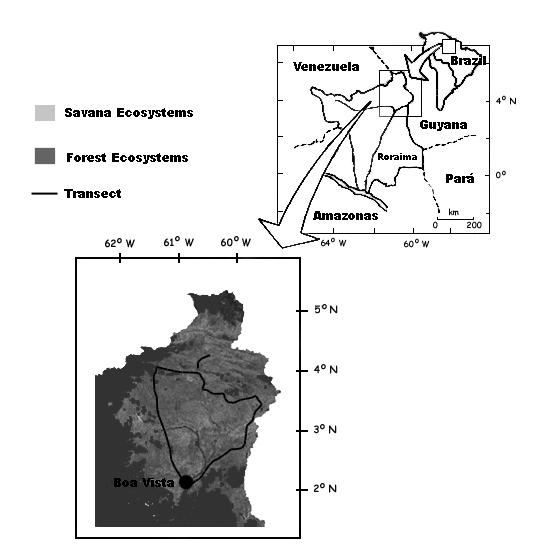
Fig. 2
Fig. 3
Fig. 4
![]()