Introduction
Forest fires of great proportions
in areas with high humidity in Amazonia could be considered as rare events, and
only a short while ago few people would have believed that real a danger
existed of such fires taking place (Uhl et al., 1988; Kauffman, 1991; Nelson
and Irmão, 1998). However, in late 1997
and early 1998, fires penetrated primary forests and other types of ecosystems
of the state of Roraima, located in the extreme north of the Brazilian Amazon
(Barbosa, 1998a,b,c; Brazil, IBAMA, 1998; Brazil,
INPE, 1998, 1999a; Shulze, 1998). Fires
in savannas and transformed forest systems (secondary forests, pastures and
clearings), which are traditionally burned at this time of year, spread over
thousands of square kilometers of intact primary forest, provoking the death of
trees and the emission of million of tons of greenhouse gases to the
atmosphere. The enormous size of the
fire was credited, mainly, to the drought provoked by the strong El Niño
phenomenon of 1997-98. However, the
occurrence of the Great Roraima Fire should not be seen as an event caused
exclusively by this climatic effect.
Instead, it was the result of a series of factors acting simultaneously,
with the El Niño aggravating the effect of the pre-existing conditions. At present, the probability of events such as
this can be expected to increase over time due to pressure of human settlements
in forest areas throughout Amazonia, amplified by the increasing logging,
clearing for agriculture and burning for conversion of primary forests to
pastures, all increasing the vulnerability of the adjacent forests (Cochrane et
al., 1999; Kauffman et al., 1988; Negreiros et al., 1996; Nepstad et al., 1999a,b).
Studies are rare that try to
evaluate the risks of fires in Amazonia and their release of greenhouse
gases. With the growth of human
activities in the Amazon, there is a need to increase the volume of information
on the impacts that this type of event can cause at regional and global
levels. With this in mind, we calculated
the emissions of greenhouse gases provoked by the fires in Roraima in different
types of natural systems and agroecosystems that were affected by fire in 1997
and 1998. In order to calculate these
emissions we estimated the following parameters: (a) the area of each natural
system and agroecosystem affected, (b) the total plant biomass (above and below
ground) per unit of area, (c) mortality of trees due to the fire, (d) the
formation of charcoal in the systems affected, (e) burning efficiency for the
different biomass categories that it comprise each system and (f) the
concentration of carbon in each of these categories.
General description of the Area
Roraima is one of the former
federal territories transformed into states by Brazil’s 1988 constitution,
located in the northernmost portion of the Brazilian Amazon. The local population tripled between 1980 and
1998, growing from 82,018 to 260,705 inhabitants (Brazil, IBGE, 1999). The migratory explosion of this period was
motivated by local public authorities in three phases: (a) at the end of the
1970s, with support of the Federal Government as part of the POLORORAIMA
sub-program of the Amazonian Development Poles Program (POLOAMAZÔNIA), (b)
through the “mining boom” in the Yanomami indigenous lands at the end of the
1980s, when the territory was transformed into a state and (c) in the early
1990s through state government programs to recruit migrants in other parts of
the country with land-tenure problems (Barbosa, 1993). The population growth
provoked an increase by 55.6 fold in the total area of deforestation, expanding
from 100 km2 in 1978 to 5,560 km2 in 1997 (Brazil, INPE,
1999b).
The natural vegetation of Roraima
is a mosaic of landscapes that range from savannas (northeast) to forests
(south and west), and different types of oligotrophic (nutrient-poor) systems
such as campos (grasslands), campinas
and campinaranas (low woodlands on white-sand soils) in the center-south
portion of the state (Silva, 1997). The
annual precipitation is variable and forms a gradient from 1000 mm (in the
savannas at the northeast end of the state) up to 2300 mm (southern and far
western parts of the state) (Barbosa, 1997).
The place with largest volume of climatic data is the capital at Boa
Vista. The annual average precipitation
is 1614 mm (1910 to 1995). Between
September 1997 and March 1998 the precipitation was only 30.6 mm in this area,
when the expected amount based on the historical average for same period would
be 352 mm (Brazil, DEFARA and INMET, 1999).
The relative humidity of the air was below 60% between February and
March 1998 (Brazil, MAA/INMET, 1998).
Area of the Natural Systems and Agroecosystems Affected
Original area
To determine the total area
affected by the fire, we estimated the original area of the original vegetation
types in Roraima. We used as a base a
digitization of the vegetation map of Amazonia at a scale of 1:2,500,000
(Brazil, SUDAM and IBGE, 1989), because this base uses the standard
classification typology for Brazilian vegetation described by IBGE (1992). After the macrospatial determination of the
types that make up the regional landscape, the map was scanned and color-coded
to facilitate measurement of the original areas. Based on field observations and on a mosaic
of LANDSAT-TM satellite images (1:1,000,000) (Roraima, SENAGRO and ITERAIMA,
1996), we made adjustments and modifications to the digitized map due to some
inaccuracies, such as grasslands erroneously denominated as savannas or dense
forests defined as ecotones. Using
IDRISI (Eastman, 1995), a computer program that analyzes geographical data for
spatial classification, we estimated the number of picture elements (pixels) in
each vegetation type and calculated the proportional area of each category,
considering the total area of Roraima as 225,116 km2.
To estimate the net area present in
1997-98 for each original vegetation type, two types of adjustments were
applied to the calculated areas: (a) for human-altered areas (rural and urban)
and (b) for watercourses (major rivers).
The rural areas were quantified based on the results obtained by the
National Institute for Space Research (Brazil, INPE, 1999b) for areas
deforested up to 1997, updated to 1998 based on the mean annual area of
deforestation for the 1992-1997 period.
The distribution of deforested areas among pasture, agriculture and
secondary forests up to 1997-98, was obtained from the proportions based on the
mean of four results: (a) the 1985 agricultural census (Brazil, IBGE, 1985),
(b) the 1995-1996 agricultural census (Brazil, IBGE, 1996), (c) Fearnside (1996)
for three equilibrium landscapes in the year 1990 and (d) the summary of the
National Institute for Colonization and Agrarian Reform (INCRA) diagnostic
evaluation of settlements in Roraima 1998-1999 (Luz, 1999). The areas determined for the three human-altered
categories were subtracted from the forest eco-region to which each belonged,
in proportion to the number of linear kilometers of existing access roads in
each system, assuming a direct relationship between roads and deforested areas. The urban areas were computed by
extrapolation of the mean number of pixels contained in each county seat. Adjustments were made in the same way as
those for rural human-altered areas, subtracting from the area of the landscape
type where the each city is located. To
estimate the area of the major watercourses we used the same procedure as that
used for the calculation of the typological units.
Area Burned
In order to calculate the area
affected by fire in each type of forest or oligotrophic vegetation we digitized
the geographical coordinates obtained in 16.5 hours of overflights by Barbosa
(1998b) in the Geographical Information System (SGI/INPE, version 7.0) at the
Executive Secretariat of the Ecological-Economic Zoning of Roraima (ZEE/RR). Additions and corrections were applied to the
original limits of these geographical points based on field observations and,
in the case of analysis of LANDSAT-TM and DMSP satellite images, based on
partial reports presented by INPE (1998, 1999a). Once this was done, three blocks were
established distributed along the border between the forest and the
savanna. These blocks represented the
major regional divisions where the fire was present: (a) Block 1: eastern
section, between the left bank of the Rio Branco and the Rio Tacutu (Cantá--RR
170 Highway-–Anauá River), (b) Block 2: western section; between the right bank
of the Rio Branco and the Rio Uraricoera (Caracaraí–-Rio Uraricoera) and (c)
Block 3: northern section; between the left bank of the Rio Uraricoera and the
right bank of the Rio Tacutu (Maracá Island--Pacaraima). In addition, the blocks were subdivided into
zones for different intensities of burning in the forest: (a) high intensity,
or more than 50% of the forested area affected, (b) medium intensity, or between
5 and 50% affected and (c) low intensity, or below 5% affected (but with some
alterations). The intensity zones
received different treatments in the analysis.
The blocks were overlayed on the
vegetation base map derived from the map of SUDAM and IBGE (1989) in order to
estimate the area affected by the fire in each type of forest or oligotrophic
vegetation (grasslands, campinas and campinaranas). The affected area represented the total area
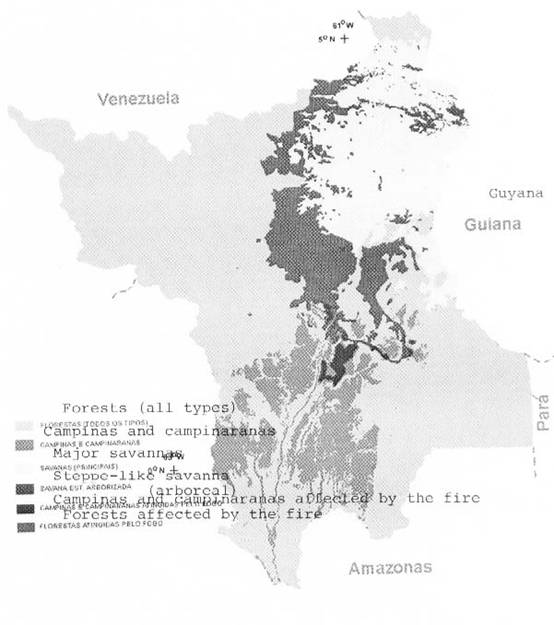
where the fire was present (Fig. 1).
However, for the forest systems, it was necessary to adjust for
human-affected areas, watercourses, and other unburned landscapes, etc., in
order to avoid double-counting and/or counting habitats that did not burn. In addition, the area of forest (already
adjusted) also had to be adjusted based on the intensity of burning at the
site. This was due to the distinct
behavior of the fire in each of the intensity zones. Because of this, we defined a burning factor
for each of the areas based on aerial photographs obtained in the overflights
made during and after the fires. Based
on this methodology, the area of forest effectively burned (the area where the
fire really provoked some kind of damage to the system) was 11,394 km2
(Table 1).
[Figure 1 and
Table 1 here]
|
Table 1 - Area
(km2) of intact forest affected and effectively burned in each
impact zone (Total for all blocks).
|
|
|
|
|
|
|
|
|
|
|
|
|
|
|
|
Gross area affected
(km2)
|
Deductions
|
Net area
affected
(km2)
|
Mean burn factor (1)
(%)
|
Area
effectively
burned
(km2)
|
Mean burn factor (2)
(%)
|
Area
effectively
burned
(km2)
|
|
Impact
zone
|
|
|
|
|
|
Rivers
(km2)
|
Other natural environments
(km2)
|
Human-altered environments
(km2)
|
|
|
|
|
|
|
|
|
|
|
|
|
|
|
|
|
|
|
|
High Impact
|
13,687
|
120
|
981
|
1,789
|
10,797
|
85.1
|
9,189
|
-
|
-
|
|
Medium Impact
|
6,022
|
48
|
416
|
1,145
|
4,413
|
33.7
|
1,487
|
-
|
-
|
|
Low Impact
|
1,583
|
12
|
23
|
320
|
1,229
|
7.3
|
90
|
-
|
-
|
|
|
|
|
|
|
|
|
|
|
|
|
|
Sub-total
|
21,292
|
180
|
1,419
|
3,253
|
16,439
|
52.7
|
10,766
|
80.9
|
13,299
|
|
|
|
|
|
|
|
|
|
|
|
|
|
High Impact
(SN)(3)
|
2,049
|
17
|
0
|
20
|
2,012
|
31.2
|
628
|
-
|
628
|
|
|
|
|
|
|
|
|
|
|
|
|
|
|
|
|
|
|
|
|
|
|
|
|
|
Total
|
|
23,341
|
198
|
1,419
|
3,273
|
18,451
|
-
|
11,394
|
|
13,928
|
|
|
|
|
|
|
|
|
|
|
|
|
|
|
|
|
|
|
|
|
|
|
|
|
|
(1) calculation considering the burn factor for each block and
impact zone.
|
|
|
|
|
|
|
|
|
|
|
|
|
|
(2) calculation considering the burn factor determined by
IBAMA (1998) for the total area of the fire in forest systems.
|
|
(3) SN - area
of ecological tension; contact savanna / seasonal forest. This was determined together with the transects in the savannas because they cut this
landscape type. This calculation was done separately.
|
|
|
|
|
|
|
|
|
|
|
|
|
|
|
|
|
|
|
|
|
|
|
|
|
|
|
Emissions estimates are subject to
a high degree of uncertainty due to the fire being restricted to surface
burning that did not provoke stress in the crowns of the trees in some places
and, therefore, was not detected by either the aerial photographs or the
satellite images. We therefore estimated
a range for the burned area for the purpose of calculating emissions. The lower bound of this range was formed by
the value calculated above and the upper bound by using the burning factor observed
by a ground team mounted by the Brazilian Institute for the Environment and
Renewable Natural Resources (IBAMA) (Brazil, IBAMA, 1998), which found 80.9% of
the forest area to have some damage by the fire (effectively burned),
independent of fire intensity. Applying
this percentage to the total area affected, we determined the range for area
effectively burned as 11,394-13,928 km2 or, 7.4-9.0% of the whole
forested area present. We use the
midpoint of this interval to calculate the emissions.
Our current estimate is higher than
the first results estimated by Barbosa (1998a,b) from overflights of the
affected areas (7800-9200 km2) and by INPE (1999) from LANDSAT-TM
satellite images (11,730 km2).
In the first case, several areas were not quantified due to the limited
aerial coverage and, in the second, the limit was due to the quality of the
images and the impossibility of detecting ground fires that did not stress the
leaf cover of the trees. However, in any
of the above-mentioned estimates, the values are greater than the total area
deforested in Roraima up to 1997 (5560 km2) and much higher than the
estimates announced previously by the government for the Great Roraima Fire
(3000 km2) (Braga, 1998).
With respect to the procedure to
determine the proportion of area burned in human-affected systems (pasture,
secondary forests and agricultural fields), we made four ground transects
distributed in the fire-impact zones (described above): (a) Transect 1 (medium
impact): 147 km between Cantá and Vila União (RR 170), (b) Transect 2 (low
impact): 76 km connecting the towns of Novo Paraíso (BR 174/210), Martins
Pereira, Vila Moderna and back to Novo Paraíso, (c) Transect 3 (medium impact):
60 km between the town of Mucajaí and the boundary between Iracema and
Caracaraí counties and (d) Transect 4 (high impact): 64 km from side road (vincinal)
No. 1 of the Apiaú settlement area, side road No. 9, cross-cutting access road
(travessão) No. 9, Ribeiro Campos and side road No. 7. In each of these transects we quantified the
number of lots
that were affected by humans in each category (pasture, secondary forest or
agricultural fields) and condition (burned or unburned). We then estimated the mean percentage of
burned area by fire-impact zone in these transformed forest habitats. Of the 5776 km2 of human-affected
areas present in Roraima up to 1998 (including 220 km2 of new
clearings), we calculated that 48.1% (2780 km2) had been effectively
burned. The highest burning factors were
found for the areas located in the high fire-intensity zones, for secondary
forests (73.7%) and pasture (62.7%). The lowest factor was found for
agricultural fields in the areas with low burning intensity (15.4%).
For the oligotrophic systems, the
total burned area was estimated to be 1388 km2, taking into
consideration the procedures adopted previously. For the calculation of the total area burned
in the savannas, the procedure (Barbosa, 1998b) uses the measurements made
between July 1997 and June 1998 on the transects established along 540.1 km of
highways that cut through all of the main types of savannas in Roraima. The burned area of this landscape totaled
22,583 km2. A summary of the
original areas and of the effectively burned area by vegetation type is given
in Table 2.
[Table 2 here]
|
Table 2 - Original area and
area effectively burned of the vegetation types (natural and agroecosystems)
present in Roraima in 1997-98.
|
|
|
|
|
|
|
|
|
|
|
|
|
|
|
|
|
|
|
|
|
Area 1997-98 (km2)
|
Percent of area burned
relative to the area present
|
|
Category
|
Code
|
Group
|
Sub-group
|
Class
|
|
|
|
|
|
|
|
|
Present
|
Effectively
Burned
|
|
|
|
|
|
|
|
|
Dense forest
|
|
|
|
|
|
|
|
|
|
Da-0
|
ombrophilous forest
|
dense forest
|
alluvial
|
2,573
|
0
|
0.0
|
|
|
Db-0
|
ombrophilous forest
|
dense forest
|
lowland
|
7,959
|
0
|
0.0
|
|
|
Dm-0
|
ombrophilous forest
|
dense forest
|
montane
|
21,457
|
0
|
0.0
|
|
|
Ds-0
|
ombrophilous forest
|
dense forest
|
submontane
|
72,,821
|
2,657
|
3.6
|
|
|
|
|
|
|
|
|
|
|
|
Sub-total, Dense Forest
|
|
|
|
104,810
|
2,657
|
2.5
|
|
|
|
|
|
|
|
|
|
|
Non-dense
forest
|
|
|
|
|
|
|
|
|
|
As-0
|
ombrophilous forest
|
open forest
|
submontane
|
8,197
|
4
|
0.0
|
|
|
Fs-0
|
seasonal forest
|
semidecíduous
|
submontane
|
1,286
|
485
|
37.7
|
|
|
ON-0
|
areas of ecological tension
and
contact
|
|
ombrophilous forest /
seasonal forest
|
|
|
|
|
|
|
|
|
17,230
|
7,010
|
40.7
|
|
|
SN-0
|
areas of ecological tension
and
contact
|
|
|
|
|
|
|
|
|
|
savanna / seasonal forest
|
1,975
|
628
|
31.8
|
|
|
SO-0
|
areas of ecological tension
and
contact
|
|
|
|
|
|
|
|
|
|
savanna / ombrophilous
forest
|
4,456
|
215
|
4.8
|
|
|
LO-0
|
areas of ecological tension
and
contact
|
|
vegetation woody
oligotrophic formations of swamps and white sand areas / ombrophilous forest
|
|
|
|
|
|
|
|
16,674
|
394
|
2.4
|
|
|
|
|
|
|
|
|
|
|
|
|
|
|
|
|
|
|
|
|
Sub-total, Non-dense Forest
|
|
|
49,817
|
8,737
|
17.5
|
|
|
|
|
|
|
|
|
|
|
Non-forest
|
|
|
|
|
|
|
|
|
|
Ld-0
|
oligotrophic woody
vegetation
of swamps and white sand
areas
|
arboreal dense
|
12,256
|
524
|
4.3
|
|
|
La-0
|
vegetation woody
oligotrophic
of swamps and white sand
areas
|
|
arboreal open
|
134
|
0
|
0.0
|
|
|
|
|
|
|
Lg-0
|
vegetation woody
oligotrophic
of swamps and white sand
areas
|
|
grassy-woody
|
11,573
|
864
|
7.5
|
|
|
|
|
|
|
|
|
|
|
|
|
|
|
|
Sub-total, Oligotrophic
formations
|
|
|
|
23,962
|
1,388
|
5.8
|
|
|
|
|
|
|
|
|
|
|
|
rm-0
|
ecological refuge
|
high altitude
|
montane
|
205
|
32
|
15.5
|
|
|
Sg-0
|
savanna
|
savanna
|
grassy-woody
|
15,004
|
7,932
|
52.9
|
|
|
Sp-0 (2)
|
savanna
|
savanna
|
park
|
12,443
|
7,329
|
58.9
|
|
|
Td-3 (2)
|
steppe-like savanna
|
Roraima grasslands
|
arboreal dense
|
2,313
|
1,779
|
76.9
|
|
|
Tp-3
|
steppe-like savanna
|
Roraima grasslands
|
park
|
8,733
|
5,511
|
63.1
|
|
|
|
|
|
|
|
|
|
|
|
Sub-total, Savannas
|
|
|
|
38,697
|
22,583
|
58.4
|
|
|
|
|
|
|
|
|
|
|
Human-altered(1)
|
Rural
|
pastures
|
|
|
3,063
|
1,538
|
50.2
|
|
|
|
secondary forests
|
|
|
1,699
|
854
|
50.3
|
|
|
|
agricultural fields
|
|
|
794
|
169
|
21.2
|
|
|
|
deforestation in 1998
|
|
|
220
|
220
|
100.0
|
|
|
|
|
|
|
|
|
|
|
|
Sub-total Human-altered
|
|
|
|
5,776
|
2,780
|
48.1
|
|
|
|
|
|
|
|
|
|
|
|
Urban
|
cities
|
|
|
251
|
0
|
-
|
|
|
|
|
|
|
|
|
|
|
Watercourses(3)
|
|
|
|
|
1,803
|
0
|
-
|
|
|
|
|
|
|
|
|
|
|
Total area (km2)
|
|
|
|
|
225,116
|
38,144
|
16.9
|
|
|
|
|
|
|
|
|
|
|
|
|
|
|
|
|
|
|
|
(1) Rural: considered as
change in land use only in forest areas, especially in the vegetation types
Ds, ON, Fs, LO and As; Urban: municipal seats (distributed as
|
|
follows: 5 for Ds; 4 for ON; 1 for LO; 1 for SN; 2 for Sg; 1
for Sp and 1 for Tp). Areas deforested in the year of the fire were
considered to be totally accessible to the fire.
|
|
(2) Sp represents, for
calculation purposes, the sum of Sp and Sa, and Td represents, for
calculation purposes, the sum of Td and Ta.
|
|
|
|
(3) Represents the
principal rivers of Roraima
|
|
|
|
|
|
|
Total Original Plant Biomass
Present biomass
The calculation procedure for most
of the forest eco-regions (dense and non-dense), was based on the
volume-expansion method (m3/ha) and biomass (t/ha) calculation of
Brown and Lugo (1992), adjusted by the method of Fearnside (1992). For Roraima, this method underwent
adjustments in the categories "dead above-ground biomass" and
"below-ground biomass." For
these two items, new studies were added to those adopted previously by
Fearnside (1992), such as one for Maracá Island (Scott et al., 1992; Thompson
et al., 1992; Nascimento, 1994; Villela, 1995) and, discarded others that did
not fit the characteristics of vegetation types present in Roraima. Regional-scale volumetric data (m3/ha)
were obtained from volumes 8, 9, 10, 11, 14 and 18 of Projeto RADAMBRASIL
(1975-1978), which cover the whole State of Roraima and neighboring areas where
vegetation types similar. The mean total
biomass (weighted by area) of all dense forests was 320 t/ha and, of non-dense
forests was 279 t/ha (Table 3). In both
cases, there is a reduction of 25% and 34%, respectively, with respect to the
estimates by Fearnside (1997b) for carbon emissions from deforestation in
Roraima in 1990.
[Table 3 here]
|
Table 3 - Total
biomass estimated by vegetation type (t/ha) in Roraima in1997-98.
|
|
|
|
|
|
|
|
|
|
|
|
|
|
|
|
|
|
|
|
|
|
|
Biomass (t/ha)(2)
|
|
|
|
|
|
|
|
|
Category
|
Code
|
|
|
|
|
|
|
|
|
|
|
|
|
Above-ground
|
Below-ground
Live
|
Total
|
|
|
|
|
|
|
|
|
|
Live
|
Dead
|
|
|
|
|
|
|
|
|
Dense forest
|
|
|
|
|
|
|
|
|
|
|
|
|
|
Da-0
|
275
|
21
|
47
|
343
|
|
|
|
|
|
|
|
|
Db-0
|
276
|
21
|
47
|
345
|
|
|
|
|
|
|
|
|
Dm-0
|
232
|
18
|
40
|
290
|
|
|
|
|
|
|
|
|
Ds-0
|
261
|
20
|
45
|
326
|
|
|
|
|
|
|
|
|
|
|
|
|
|
|
|
|
|
|
|
|
|
Weighted average, Dense
forest
|
257
|
20
|
44
|
320
|
|
|
|
|
|
|
|
|
|
|
|
|
|
|
|
|
|
|
|
|
Non-dense
forest
|
|
|
|
|
|
|
|
|
|
|
|
|
|
Os-0
|
226
|
17
|
39
|
283
|
|
|
|
|
|
|
|
|
Fs-0
|
226
|
17
|
39
|
283
|
|
|
|
|
|
|
|
|
ON-0
|
226
|
17
|
39
|
283
|
|
|
|
|
|
|
|
|
|
|
|
|
|
|
|
|
|
|
|
|
|
SN-0
|
158
|
12
|
27
|
197
|
|
|
|
|
|
|
|
|
|
|
|
|
|
|
|
|
|
|
|
|
|
SO-0
|
158
|
12
|
27
|
197
|
|
|
|
|
|
|
|
|
|
|
|
|
|
|
|
|
|
|
|
|
|
LO-0
|
234
|
32
|
40
|
306
|
|
|
|
|
|
|
|
|
|
|
|
|
|
|
|
|
|
|
|
|
|
|
|
|
|
|
|
|
|
|
|
|
|
|
|
|
|
|
|
|
|
|
|
|
|
|
|
Weighted average, Non-dense
forest
|
220
|
22
|
38
|
279
|
|
|
|
|
|
|
|
|
|
|
|
|
|
|
|
|
|
|
|
|
Non-forest
|
|
|
|
|
|
|
|
|
|
|
|
|
|
Ld-0
|
39.8
|
7.8
|
69.0
|
117
|
|
|
|
|
|
|
|
|
|
|
|
|
|
|
|
|
|
|
|
|
|
La-0
|
33.8
|
5.0
|
21.3
|
60
|
|
|
|
|
|
|
|
|
|
|
|
|
|
|
|
|
|
|
|
|
|
Lg-0
|
5.8
|
3.7
|
42.0
|
52
|
|
|
|
|
|
|
|
|
|
|
|
|
|
|
|
|
|
|
|
|
|
|
|
|
|
|
|
|
|
|
|
|
|
|
Weighted average, Oligotrophic formations
|
23.3
|
5.8
|
55.7
|
85
|
|
|
|
|
|
|
|
|
|
|
|
|
|
|
|
|
|
|
|
|
|
rm-0
|
2.7
|
0.4
|
10.0
|
13
|
|
|
|
|
|
|
|
|
Sg-0
|
2.9
|
0.4
|
10.9
|
14
|
|
|
|
|
|
|
|
|
Sp-0
|
5.4
|
0.6
|
20.3
|
26
|
|
|
|
|
|
|
|
|
Td-3
|
26.1
|
2.9
|
66.5
|
95
|
|
|
|
|
|
|
|
|
Tp-3
|
5.2
|
0.4
|
13.3
|
19
|
|
|
|
|
|
|
|
|
|
|
|
|
|
|
|
|
|
|
|
|
|
Weighted average, Savannas
|
5.6
|
0.6
|
17.8
|
24
|
|
|
|
|
|
|
|
|
|
|
|
|
|
|
|
|
|
|
|
|
Human-altered
|
Rural:
|
|
|
|
|
|
|
|
|
|
|
|
|
|
|
|
|
|
|
|
|
|
|
|
|
|
pasture (1)
|
11.2
|
65.5
|
12.2
|
89
|
|
|
|
|
|
|
|
|
secondary forest
|
30.9
|
112.4
|
22.8
|
166
|
|
|
|
|
|
|
|
|
agricultural fields
|
0.4
|
59.3
|
9.5
|
69
|
|
|
|
|
|
|
|
|
deforestation, 1998
|
0.0
|
271.2
|
43.2
|
314
|
|
|
|
|
|
|
|
|
|
|
|
|
|
|
|
|
|
|
|
|
|
Weighted average, Human altered
|
15.1
|
86.3
|
16.1
|
117
|
|
|
|
|
|
|
|
|
|
|
|
|
|
|
|
|
|
|
|
|
|
Urban:
|
-
|
-
|
-
|
-
|
|
|
|
|
|
|
|
|
|
|
|
|
|
|
|
|
|
|
|
|
Watercourses(3)
|
|
-
|
-
|
-
|
-
|
|
|
|
|
|
|
|
|
|
|
|
|
|
|
|
|
|
|
|
|
Total area (km2)
|
|
|
|
|
|
|
|
|
|
|
|
|
|
|
|
|
|
|
|
|
|
|
|
|
|
|
|
|
|
|
|
|
|
|
|
|
|
|
(1) Average of two pastures in the area of Apiaú,
Roraima. Live above-ground is the sum of grass and small herbs and
bushes. Dead above-ground encompasses
all plant material above the ground that is part of the mass of the pasture
and the mass of the former forest (logs, for instance). (Barbosa &
Fearnside, 1996).
|
|
|
|
|
|
|
|
|
|
|
|
|
|
|
|
|
(2) Methodology for
obtaining the biomass (live and dead)
above- and below-ground:
|
|
|
|
|
|
Da – Volume-expansion
method of Brown & Lugo (1992), corrected with the adjustment factors of
Fearnside (1992), modified for above-ground dead mass and below-ground live
mass.
|
|
|
Db -- Volume-expansion
method of Brown & Lugo (1992), corrected with adjustment factors of
Fearnside (1992), modified for above-ground dead mass and below-ground live
mass.
|
|
|
Dm -– Volume-expansion method of Brown & Lugo
(1992) corrected with the adjustment factors of Fearnside (1992), modified for above-ground dead mass and below-ground
live mass. (two values were considered : a) Roraima sedimentary plateau (10.7%) and b)
Parima mountains (89.3%)).
|
|
|
Ds -– Volume-expansion method of Brown & Lugo (1992)
corrected with the adjustment factors of Fearnside (1992), modified for
above-ground dead mass (two values were used (simple average): a) low chain
of mountains of the Guianan complex and b) dissected landscape of the Guianan
complex).
|
|
|
As - For lack of local
references, the value determined for ON was used.
|
|
|
|
|
|
Fs - For lack of local
references, the value determined for ON was used
|
|
|
|
|
|
ON - Volume-expansion
method of Brown & Lugo (1992) corrected with the adjustment factors of
Fearnside (1992), modified for above-ground dead mass and below-ground live
mass.
|
|
|
SN - Volume-expansion
method of Brown & Lugo (1992) corrected with the adjustment factors of
Fearnside (1992), modified for above-ground dead mass and below-ground live
mass.
|
|
|
SO - For lack of references, the value for SN was used
(this was modified starting from the values obtained for "La"
(RADAM), and compared to the results of Silva (1993))
|
|
|
LO - Used as the average of three values to compose
the live and dead above-ground biomass: a) volume expansion; b) "bana
alta" (tall Amazon caatinga), by Bongers et al. (1985) and c)
Amazon Savanna, in Venezuela, by Klinge & Herrera (1983). For
below-ground biomass, the average of all the remaining of the groups was
used, to derive the percentage relative to the above-ground live biomass.
|
|
|
Ld - For lack of local
references, the value for Venezuelan “low bana" (Low Amazon Caatinga),
in Venezuela, of Bongers et al. (1985) was used
|
|
|
La - Obtained starting from the fieldwork of
Cavalcanti & Higuchi (in press.) in the south of Roraima in the landscape
denominated "Campina/Campinarana." The values of these authors for fresh
weights were converted to dry weight following the methodology of Carvalho et
al. (1995) and Higuchi et al. (1997).
The correction for the mass of other components was made using the
averages obtained by Bongers et al (1985) for the component "others” in
Venezuelan bana.
|
|
|
Lg - For lack of local
references, the value determined for Venezuelan "open" bana
(Open Amazon caatinga) by Bongers et al. (1985) was used.
|
|
|
rm - Estimate based on the
low stratum of the landscapes Sg, Sp and Tp.
|
|
|
|
|
|
|
Sg – Above-ground biomassl (live and dead) from
Barbosa (1998) and, below-ground biomass, assumed as the average of the
results found by Castro & Kauffman (1998), for " clean " field
and campo sujo ("dirty" grassland) to a depth of 2 m, near
Brasília (3.78 times the live above-ground mass).
|
|
|
Sp (and Sa) – Above-ground biomass (live and dead)
from Barbosa (1998) and, below-ground biomass, assumed to be the obtained average of the results of
Castro & Kauffman (1998), for campo limpo ("clean"
grasslands) and campo sujo "dirty" grasslands to a depth of
2 m near Brasília (3.78 times the live above-ground mass).
|
|
|
Tp - Biomass above ground (live and dead) according to
Barbosa (1998) and, below-ground biomass, assumed to be the average of the
results of Castro & Kauffman (1998) for "open" cerrado
(central Brazilian savanna) and "dense" cerrado to 2-m depth near Brasília (2.55
times the live above-ground mass).
|
|
|
Td (and Ta) - The value of Fearnside et al. (nd) - for
above-ground biomass was assumed (29 t/ha) and was partitioned between live
and dead fractions, based on the average of the other values for savanna
found in the table. For below-ground
biomass, the method was the same as that adopted for Tp.
|
|
|
Pasture - Live above-ground biomass is the simple
average of two samplings in the area of Apiaú, Roraima (Barbosa &
Fearnside, 1996) (the value for dead above-ground biomass was considered to
be the same as that determined for secondary forest - both systems are
derived from deforestation; because pasture is a deforested landscape, the
below-ground biomass
was considered as an average of the below-ground biomass of all forest systems).
|
|
|
Secondary forest – Above-ground biomass is assumed to
be the value determined for 6-7 year-old secondary forest in the area of
Apiaú, Roraima (Fearnside et al., nd) (dead biomass was considered to be
original-forest remains in the same study and, below-ground biomass is calculated
using the same relationship as that described above for pasture).
|
|
|
Agricultural fields - Assumed to be the same as that
given by Fearnside (1997a) for "farmland" (the value for above-ground dead biomass
was considered to be the simple average of the dead above-ground mass of
pastures and secondary forests and the live biomass of newly deforested areas
- all considered transformed environments.
|
|
|
Recently deforested - Considered as the biomass
present at the time of felling. This was derived from the values determined
for Ds, ON, Fs, LO and As. The dead above-ground biomass is that calculated for this group
plus the pre-existing litter (fine and coarse).
|
|
For the non-forest oligotrophic
systems (grasslands, campinas and campinaranas), besides the RADAMBRASIL
timber volume data, we used existing studies in similar eco-regions in
Venezuela (Bongers et al., 1985; Klinge and Herrera, 1983) and a study carried
out in the south of Roraima by a team from the Tropical Forestry Department at
INPA in 1992 (Niro Higuchi, personal communication). The values for total biomass varied from 52
t/ha to 117 t/ha for these systems. The
values for other non-forest eco-regions (savannas), were adjusted based on
studies of R.I.B. that are underway since 1994 for estimation of emissions of
greenhouse gases from burning in Amazonian savannas. To estimate below-ground biomass in savannas
we used the proportions obtained by Castro and Kauffman (1998) in the cerrado
savannas of central Brazil. In general,
the total biomass (above- and below-ground) of these systems was 13-95 t/ha,
depending on the proportion of trees present in each habitat.
Estimate of the pre-existing
biomass in the human-affected systems were derived as follows: (a) pastures we
used the simple average among two pastures (7 and 9 years of age) studied in
the area of Apiaú, Roraima, by Barbosa and Fearnside (1996); for above-ground
biomass we considered the sum of the mass of grass and small non-woody
herbs. For the above-ground biomass
killed we considered the same study and determined the average of the whole
mass of the forest residues found in the two pastures; for the below-ground
biomass we considered the existing mean proportions in the other transformed
systems to determine the percentage with respect to live above-ground biomass;
(b) secondary forests: we used the results obtained by Fearnside et al. (nd) in
a five-year-old secondary forest in the area of Apiaú, Roraima; (c)
agricultural fields: we assumed the value determined by Fearnside (1997a) for
live above-ground biomass and we used the same proportional result (live/dead)
for dead above-ground biomass in the pastures at Apiaú; (d) 1998 deforestation:
we considered as the present biomass at the time of cutting (before the burn);
this value was estimated by weighing, based on area of each of the other forest
types that are subjected to deforestation in Roraima. The results for total biomass in these
systems were: 89 t/ha (pasture), 166 t/ha (secondary forest), 69 t/ha
(agricultural fields) and 314 t/ha (recently deforested areas).
Forest arboreal biomass killed by
the Fire
To survey the biomass killed in the
different forest types we carried out post-fire studies in three areas affected
by the fires: (a) Apiaú/Ribeiro Campos, (b) Trairão/Tepequém and (c) Paredão,
all in the ON type (area of ecological tension or ecotone and contact between
ombrophilous and seasonal forests). For
the arboreal species above 10 cm diameter at breast height (DBH), we established
seven 750-m2 transects, three of which were
at the first site, three at the second and one at the third. Each transect was divided into 6 quadrats of
125 m2 (5 m × 25 m), separated by a distance of 20 m. In each quadrat we measured the DBH of all
individuals killed (dry cambium and/or crown with dry leaves) and we applied
the general formula for biomass determination (fresh weight) for tropical
forest trees given by Carvalho et al. (1995) and Higuchi et al. (1997, 1998).
The value was adjusted for dry weight (t/ha) following the
recommendations of these authors. With
this, we reached the result of 5.8 t/ha for the 2173 individuals killed with
DBH below 10 cm and 17.4 t/ha for the 46 individuals killed with DBH above 10
cm (Table 4).
[Table 4 here]
|
Table 4 - Mortality of
individuals (number/ha) and of above-ground arboreal biomass (t/ha)
determined in three studies after the burn in Roraima.
|
|
|
|
|
|
|
|
|
|
|
|
|
|
|
|
|
|
|
|
|
|
|
|
|
|
|
|
|
|
|
|
|
|
|
|
|
|
|
|
|
|
|
|
Simplified
diameter classes (cm)
|
Above-ground
arboreal average
|
|
|
|
Parameters
|
|
|
|
|
|
|
|
|
|
|
|
|
< 5
|
5-10
|
> 10
|
Individuals
|
Biomass
|
Source
|
|
|
|
no./ha
|
t/ha
|
no./ha
|
t/ha
|
no./ha
|
t/ha
|
no./ha
|
t/ha
|
|
|
|
|
|
|
|
|
|
|
|
|
|
|
|
|
Total individuals or
biomass(1)
|
2,120
|
5.6
|
307
|
19.9
|
585
|
219.7
|
3,011
|
245.2
|
|
|
|
Dead
|
|
1,933
|
3.0
|
240
|
2.8
|
46
|
17.4
|
2,219
|
23.3
|
This study
|
|
(%) mortality
|
91.2
|
54.2
|
78.3
|
14.1
|
7.9
|
7.9
|
73.7
|
9.5
|
|
|
|
|
|
|
|
|
|
|
|
|
|
|
|
|
Total individuals or
biomass(2)
|
|
|
340
|
|
425
|
|
|
|
|
|
|
Dead
|
|
|
|
122
|
3.0
|
68
|
16.1
|
|
|
Santos et al.
(1998)
|
|
(%) mortality
|
|
|
35.9
|
|
16.0
|
|
|
|
|
|
|
|
|
|
|
|
|
|
|
|
|
|
|
|
Total individuals or biomass
|
|
|
|
|
616
|
|
|
|
|
|
|
Dead
|
|
|
|
|
|
50
|
|
|
|
Brazil, IBAMA
(1998)
|
|
(%) mortality
|
|
|
|
|
8.1
|
|
|
|
|
|
|
|
|
|
|
|
|
|
|
|
|
|
|
|
|
|
|
|
|
|
|
|
|
|
|
|
|
(1) For DBH $ 10 cm in the following
locations: Apiaú/Ribeiro Campos, Trairão/Tepequém and Paredão; for DBH <
10 cm in the following locations: Apiaú/Ribeiro Campos.
|
|
(2) Area of
Apiaú/Mucaja.í
|
|
(3) Includes palm trees.
Evaluation of the areas of the arc of fire connecting the areas of Roxinho,
Caracaraí, Apiaú, Pacaraima and Trairão.
|
These values are similar to the
16.1 t/ha determined by Santos et al. (1998) for individuals killed above 10 cm
DBH in the Apiaú area and they are similar to the results of the survey of
individual mortality that the IBAMA teams carried out in five areas affected by
the fires, which found a mean of 50 dead individuals/ha with DBH above 10 cm,
including palms (Brazil, IBAMA, 1998). However,
the variation in the values distributed among the diameter classes and sites
reflects a great variation among the areas studied, in spite of all of the
areas being classified as belonging to the same forest category (ON). With respect to other studies carried out in
similar situations, our percentage value for individual mortality (7.9% for DBH
above 10 cm) is 5.5 times less than to the 44% found for burned areas derived
from forests that has been selectively logged in Paragominas (Holdsworth and
Uhl, 1997) and, 7.6 times less than the 60.3% mean mortality found eight months
after the burn at four other sites in Paragominas county in already disturbed
forest areas (Kauffman, 1991). In terms
of total above-ground arboreal biomass killed, our values represent less than
half of the 50 t/ha of dead mass for a light fire (area burned only once)
studied by Cochrane and Schulze (1999) south of the town of Tailândia,
Pará. Although differences exist between
natural forest structures and those disturbed by human action, the comparisons
mentioned above suggest the need for continued post-burn monitoring in
Roraima. Dramatic biomass change and an
increased number of individuals killed are expected, even in little-affected
systems.
Arboreal biomass killed below 10 cm
DBH was estimated by counting the individuals (dead and alive) in two 375-m2
transects (3 quadrats of 125 m2) established at Apiaú and Ribeiro
Campos. Individuals were divided into
two categories: (a) smaller than 5 cm DBH (including all seedlings and saplings
of different heights) and (b) 5-10 cm DBH.
Biomass in these two categories was estimated based on the proportion of
the individuals present (dead and alive) and the values determined for biomass
of trees below 10 cm DBH in the estimates described above for total biomass by
forest type.
Formation of Charcoal
To estimate the amount of charcoal
formed by the fire in the primary forest systems, we established 20 1-m2
quadrats, at the Apiaú and Ribeiro Campos sites. The quadrats were distributed as follows: (a)
11 where the fire was considered to be of high intensity, (b) 5 in habitats
with damage of average intensity and (c) 4 in habitats with damage of low intensity.
In each quadrat all pieces of charcoal on the ground were collected. Wet weight was measured and dry weight was
determined later by drying the material to constant weight in an electric oven
at 105oC. We considered the
values found by intensity of burning in order to establish a mean result for
each block and for the burned area as a whole.
The mean result was 229.7 kg of charcoal formed per hectare affected by
the fire in the forest areas (Table 5).
This value is, on average, 0.089-0.104% of the total above-ground
biomass in the forests (dense and non-dense) of Roraima. This charcoal formation percentage differs
substantially from the values found for burns of transformed systems such as
pasture (2.5-3.8%), secondary forests (0.6 - 2.0%) and recent clearings (1.9%)
(Barbosa and Fearnside, 1996; Fearnside, 1997a,b;
Fearnside et al., nd).
[Table 5 here]
|
Table 5 - Formation of
superficial charcoal (t/ha) due to the fires in forest systems of Roraima
(1997-98) by fire intensity zone and block.
|
|
|
|
|
|
|
|
|
|
|
Forest burn
intensity category
|
Simple average
by Intensity (kg/ha)
|
Area
effectively burned in each Block(2)
|
|
|
|
|
|
|
|
Block 1
|
Block 2
|
Block 3
|
Total
|
|
|
(km2)
|
(km2)
|
(km2)
|
|
|
|
|
|
|
|
|
|
|
|
|
HIGH (1)
|
258.7
|
1,208
|
5,278
|
2,702
|
9,817
|
|
|
|
|
|
|
|
|
|
|
|
AVERAGE
|
51.3
|
793
|
459
|
235
|
1,487
|
|
|
|
|
|
|
|
|
|
|
|
LOW
|
9.8
|
51
|
27
|
11
|
90
|
|
|
|
|
|
|
|
|
|
|
|
Weighted
average
|
|
|
|
|
|
|
|
by block
|
-
|
172.3
|
241.0
|
241.2
|
229.7
|
|
|
(kg
charcoal/ha)
|
|
|
|
|
|
|
|
|
|
|
|
|
|
|
|
|
|
|
|
|
|
|
|
|
|
(1) We weighted the average
for the high-intensity zone because 6 quadrats were sampled at terra-firme
(upland) locations (173.9 kg/ha in 84% of the affected area) and 5 in
foothill locations (707.3 kg/ha or 16% of the affected area).
|
|
|
|
|
|
|
|
|
|
|
|
|
|
|
|
(2) The value here used was
determined the method of the fire-impact zones (11,394 km2).
|
|
|
|
Burning efficiency
For estimating burning efficiency
in forest we divided the plant material into three groups: (a) fine litter:
leaves and twigs less than 2 cm in diameter that had fallen on the forest
floor, (b) coarse litter: logs and dead branches on the ground with diameter
over 2 cm and (c) other components: other plant categories that are neither
litter nor trees. The percentage
estimates of burning efficiency were based on the average of the measurements
made by Uhl et al. (1988) in experimental burns in San Carlos (Venezuela) and
with the data collected by IBAMA at Trairão and Roxinho (Brazil, IBAMA,
1998). The largest and the smallest
values were distributed among the forest burn intensity zones and, on average, they were between 4.5% for the coarse litter in the
low-intensity zone and 97.6% for fine litter in the high-intensity zone (Table
6). For the savannas we used data from
the studies that R.I.B. has been carrying out since 1994 in the study
area. The values were lumped into a
single category of burning intensity, ranging from 28% to 94.6%, depending on
the biomass class. For human-altered
environments burning efficiency ranged from 11.9% to 97.6%.
[Table 6 here]
|
Table 6 -
Burning efficiency (%) by fire-intensity zone (forest) and by landscape type,
|
|
|
due to the fires in Roraima (1997-98).
|
|
|
|
|
|
|
|
|
|
|
|
|
|
|
|
|
|
|
|
|
|
|
|
|
|
|
|
|
|
|
|
|
|
|
|
|
|
|
|
|
|
|
|
|
|
|
|
|
|
|
|
|
|
|
|
|
|
|
|
|
|
|
|
|
|
|
|
|
|
|
|
|
|
|
|
|
|
|
|
|
|
|
|
|
|
|
|
|
|
|
|
|
|
|
|
|
|
|
|
|
|
|
|
|
|
|
|
|
|
|
|
|
|
|
|
|
|
|
|
|
|
|
|
|
|
|
|
|
|
|
|
|
|
|
|
|
|
|
|
Fine litter
|
|
Coarse litter
|
|
Other
Components
|
|
|
Category
|
Code
|
|
|
|
|
|
|
|
|
|
|
|
|
|
|
|
|
|
|
|
|
|
|
|
|
|
|
|
|
|
|
Low
|
Average
|
High
|
|
Low
|
Average
|
High
|
|
Low
|
Average
|
High
|
|
|
|
Da-0
|
|
|
|
|
|
|
|
|
|
|
|
|
|
|
Db-0
|
|
|
|
|
|
|
|
|
|
|
|
|
|
|
Dm-0
|
|
|
|
|
|
|
|
|
|
|
|
|
|
|
|
|
|
|
|
|
|
|
|
|
|
|
|
|
|
|
|
|
|
|
|
|
|
|
|
|
|
|
|
Forest
|
All
|
69.3
|
83.4
|
97.6
|
|
4.5
|
39.2
|
73.8
|
|
4.5
|
28.0
|
51.5
|
|
|
(Dense and
Non-dense) (1)
|
Types
|
|
|
|
|
|
|
|
|
|
|
|
|
|
Non-dense
forest
|
All
|
69.3
|
83.4
|
97.6
|
|
4.5
|
39.2
|
73.8
|
|
4.5
|
28.0
|
51.5
|
|
|
|
As-0
|
|
|
|
|
|
|
|
|
|
|
|
|
|
|
Fs-0
|
69.3
|
83.4
|
97.6
|
|
4.5
|
39.2
|
73.8
|
|
4.5
|
28.0
|
51.5
|
|
|
|
ON-0
|
69.3
|
83.4
|
97.6
|
|
4.5
|
39.2
|
73.8
|
|
4.5
|
28.0
|
51.5
|
|
|
|
|
|
|
|
|
|
|
|
|
|
|
|
|
|
|
SN-0
|
69.3
|
83.4
|
97.6
|
|
4.5
|
39.2
|
73.8
|
|
4.5
|
28.0
|
51.5
|
|
|
|
|
|
|
|
|
|
|
|
|
|
|
|
|
|
|
SO-0
|
69.3
|
83.4
|
97.6
|
|
4.5
|
39.2
|
73.8
|
|
4.5
|
28.0
|
51.5
|
|
|
|
|
|
|
|
|
|
|
|
|
|
|
|
|
|
|
LO-0
|
69.3
|
83.4
|
97.6
|
|
4.5
|
39.2
|
73.8
|
|
4.5
|
28.0
|
51.5
|
|
|
|
|
|
|
|
|
|
|
|
|
|
|
|
|
|
|
|
|
|
|
|
|
|
|
|
|
|
|
|
|
|
|
|
|
|
|
|
|
|
|
|
|
|
|
|
Non-forest(2)
|
Ld-0
|
-
|
-
|
83.4
|
|
-
|
-
|
39.2
|
|
-
|
-
|
28.0
|
|
|
|
|
-
|
-
|
|
|
-
|
-
|
|
|
-
|
-
|
|
|
|
|
La-0
|
-
|
-
|
|
|
-
|
-
|
|
|
-
|
-
|
|
|
|
|
|
-
|
-
|
|
|
-
|
-
|
|
|
-
|
-
|
|
|
|
|
Lg-0
|
-
|
-
|
85.5
|
|
-
|
-
|
22.6
|
|
-
|
-
|
59.4
|
|
|
|
|
-
|
-
|
|
|
-
|
-
|
|
|
-
|
-
|
|
|
|
|
|
-
|
-
|
|
|
-
|
-
|
|
|
-
|
-
|
|
|
|
|
rm-0
|
-
|
-
|
85.5
|
|
-
|
-
|
22.6
|
|
-
|
-
|
59.4
|
|
|
|
Sg-0
|
-
|
-
|
81.9
|
|
-
|
-
|
18.6
|
|
-
|
-
|
80.9
|
|
|
|
Sp-0
|
-
|
-
|
84.2
|
|
-
|
-
|
22.9
|
|
-
|
-
|
63.7
|
|
|
|
Td-3
|
-
|
-
|
85.5
|
|
-
|
-
|
22.6
|
|
-
|
-
|
59.4
|
|
|
|
Tp-3
|
-
|
-
|
90.4
|
|
-
|
-
|
26.3
|
|
-
|
-
|
33.7
|
|
|
|
|
|
|
|
|
|
|
|
|
|
|
|
|
|
Human-altered
|
Pasture
|
-
|
-
|
45.6
|
|
-
|
-
|
11.9
|
|
-
|
-
|
82.1
|
|
|
|
Secondary
forest
|
-
|
-
|
91.3
|
|
-
|
-
|
31.6
|
|
-
|
-
|
80.0
|
|
|
|
Agricultural
fields
|
-
|
-
|
91.3
|
|
-
|
-
|
21.8
|
|
-
|
-
|
81.1
|
|
|
|
Deforestation(3)
|
-
|
-
|
97.6
|
|
-
|
-
|
30.0
|
|
-
|
-
|
75.7
|
|
|
|
|
|
|
|
|
|
|
|
|
|
|
|
|
|
|
Urban
|
|
|
|
|
|
|
|
|
|
|
|
|
|
|
|
|
|
|
|
|
|
|
|
|
|
|
|
|
Watercourses(3)
|
|
|
|
|
|
|
|
|
|
|
|
|
|
|
|
|
|
|
|
|
|
|
|
|
|
|
|
|
|
Total area (km2)
|
|
|
|
|
|
|
|
|
|
|
|
|
|
|
|
|
|
|
|
|
|
|
|
|
|
|
|
|
|
|
|
|
|
|
|
|
|
|
|
|
|
|
|
|
|
|
|
|
|
|
|
|
|
|
|
|
|
|
|
(1) We
considered a general average for all types of forest systems.
|
|
|
|
|
|
|
|
|
|
|
|
|
|
|
|
|
|
(2) For non-forest systems
we took in consideration the values determined for the local savannas; for
the oligotrophic areas values are based on the biomass present in each
system.
|
|
|
|
|
|
|
|
|
|
|
|
|
|
|
|
|
|
|
(3) Burning efficiency for
thick litter and other components in "deforestation" was considered
as the same value observed in Altamira by Fearnside et al. (1999). For fine litter, we used the simple average
of the results found by the same authors in Manaus and Altamira.
|
|
|
|
|
|
|
|
|
|
|
|
|
|
|
|
|
|
|
(4) Non-forest and
human-altered systems were considered to always be in zones of high intensity
because these areas could not be differentiated into other categories due to
the great impact that the fire provoked in these systems.
|
|
|
Concentration of Carbon
The concentration of carbon (%C) in
the vegetation categories of forest systems was estimated based on the
measurements of Barbosa and Fearnside (1996) and Fearnside et al. (nd) in wood
pieces and other forest components found in pastures and secondary forests in
the Apiaú area. For the carbon
concentration in the savannas, we use the results obtained by R.I.B. in his
studies of greenhouse gas emissions from burning and decomposition in savannas
in Roraima. The results ranged from
33.0% C for litter of grassy-woody savanna up to 64.4% C for charcoal found in
the different environments (Table 7).
[Table 7 here]
|
Table 7 – Mean carbon
concentration (% C) in the ecological systems of Roraima.
|
|
|
|
|
|
|
|
|
|
|
|
|
|
|
|
|
|
Category
|
Code
|
Dead trees (above- and
below-ground)
|
Litter
(fine + coarse)
|
Other
components
|
Charcoal
(long-term pool)
|
|
|
|
|
|
|
|
|
|
|
|
|
|
|
Forest
(dense and
non-dense)
|
All forest
types
|
48.2
|
39.8
|
48.2
|
64.4
|
|
|
|
|
|
|
|
|
|
|
|
|
|
|
|
|
|
|
Non-forest
|
Ld-0
|
48.2
|
39.8
|
48.2
|
64.4
|
|
|
|
La-0
|
|
|
|
|
|
|
|
Lg-0
|
46.7
|
36.0
|
38.8
|
64.4
|
|
|
|
rm-0
|
46.7
|
36.0
|
38.8
|
64.4
|
|
|
|
Sg-0
|
47.2
|
33.0
|
36.0
|
64.4
|
|
|
|
Sp-0
|
46.8
|
36.7
|
40.2
|
64.4
|
|
|
|
Td-3
|
46.7
|
36.0
|
38.8
|
64.4
|
|
|
|
Tp-3
|
46.1
|
38.4
|
40.2
|
64.4
|
|
|
|
|
|
|
|
|
|
|
Human-altered
|
Pasture
|
44.5
|
47.8
|
43.8
|
64.4
|
|
|
|
Secondary
forest
|
44.5
|
42.9
|
45.5
|
63.2
|
|
|
|
Agricultural
fields
|
44.5
|
45.4
|
44.6
|
63.8
|
|
|
|
Deforestation
|
44.5
|
45.4
|
44.6
|
63.8
|
|
|
|
|
|
|
|
|
|
Fate of Carbon Affected by the Fire
The total mass of carbon affected
by the fires in Roraima in 1997-98 was 45.63 million tons of carbon (t C). This carbon followed three different
pathways: (a) carbon emitted instantaneously to the atmosphere by combustion:
18.90 million t C or 41.4% of the total, (b) carbon stored in the form of
charcoal on the ground in the affected systems: 0.52 million t C or 1.1% and
(c) decomposition of plant material killed by the fire (mainly trees): 26.36
million t C or 57.4% (Table 8). Of the
total affected carbon, 72.1% (32.9 million t C) can be attributed to primary
forest systems that were exposed to fire.
The systems that contributed least were the oligotrophic formations
(other non-forest systems) with 2.7% of the total affected carbon (1.25 million
t C).
[Table 8 here]
|
Table 8 - Fate of carbon
affected by the burning of vegetation in Roraima (1997-98).
|
|
|
|
|
|
|
|
|
|
|
|
|
|
|
|
|
|
|
|
|
|
System
|
Combustion
|
|
Charcoal
|
|
Decomposition
|
|
Total
|
|
|
|
|
|
|
|
|
|
|
|
|
|
(106 t)
|
(%)
|
(106 t)
|
(%)
|
(106 t)
|
(%)
|
(106 t)
|
(%)
|
|
|
|
|
|
|
|
|
|
|
|
Forests
|
12.78
|
67.6
|
0.19
|
35.9
|
19.93
|
75.6
|
32.90
|
72.1
|
|
|
|
|
|
|
|
|
|
|
|
|
|
|
|
|
|
|
|
|
|
Savannas
|
2.34
|
12.4
|
0.0006
|
0.1
|
4.80
|
18.8
|
7.14
|
15.7
|
|
|
|
|
|
|
|
|
|
|
|
|
|
|
|
|
|
|
|
|
|
Other
Non-forest systems
|
0.26
|
1.4
|
0.0003
|
0.1
|
0.99
|
3.8
|
1.25
|
2.7
|
|
|
|
|
|
|
|
|
|
|
|
|
|
|
|
|
|
|
|
|
|
Human-altered
|
3.52
|
18.6
|
0.33
|
64.0
|
0.48
|
1.8
|
4.34
|
9.5
|
|
|
|
|
|
|
|
|
|
|
|
|
|
|
|
|
|
|
|
|
|
Total
|
18.90
|
41.4
|
0.52
|
1.1
|
26.21
|
57.4
|
45.63
|
100.0
|
|
|
|
|
|
|
|
|
|
|
|
|
|
|
|
|
|
|
|
|
|
(1) Combustion =
instantaneous emission at the time of passage of the fire; charcoal =
charcoal formed by the incomplete combustion of plant material; decomposition
= material that died and began decomposing after passage of the fire.
|
Gross emissions of Greenhouse Gases
To estimate the amount of
greenhouse gases (CO2, CH4, CO, N2O, NOx
and NMHC) emitted to the atmosphere, we adopted the method of Fearnside (1997a,b), using the global warming potentials (GWPs) of the
Intergovernmental Panel on Climate Change (IPCC) for a 100-year time horizon
(Schimel et al., 1996), without adjustments for uptake of carbon from the
atmosphere by the terrestrial biota.
This method was applied to two trace-gas emission scenarios: (a) low
scenario (low trace-gas emission) and (b) high scenario (high trace-gas
emission). We did not estimate the net
emission of gases by the decomposition of the plant material killed in the
fires, or the uptake of carbon by artificial or natural sinks. Therefore, our calculations do not reflect
either the annual balance of the fire event or net committed emissions, but
rather the gross emission of gases estimated starting from the carbon emitted
instantly by combustion at the time the fire passed.
The total of emitted gases, in CO2
equivalent, was 65.0-66.1 million tons, depending on the scenario for trace-gas
emissions (Table 9). This corresponds to
17.7-18.0 million t of CO2-equivalent carbon. Most of these emissions (68.1%) were
attributed to the primary forest systems affected by the fire (12.1-12.3
million tons of CO2-equivalent carbon), followed by the
human-altered environments (3.3-3.4 million), savannas (2.1 million t) and
other non-forest systems (0.2 million t).
Even assuming a reduction of 25-34% in the previous estimates of biomass
per unit of forest area, our mean total value (17.9 million t of CO2-equivalent
C), is equal to 4.1-4.2 times the value calculated by Fearnside (1997b) for
deforestation emissions in Roraima, considering all net committed emissions for
the year of 1990 and all sources and sinks of carbon in that year (4.3-4.4
million t CO2-equivalent C).
[Table 9 here]
|
Table 9 – Gross emissions
of greenhouse gases by combustion in the Great Roraima Fire of 1997-98.
|
|
|
|
|
|
|
|
|
|
|
|
|
|
|
|
|
|
|
|
|
|
|
|
|
|
|
|
|
|
|
|
|
|
|
|
|
Low Scenario
|
|
|
|
|
|
|
|
|
|
|
|
|
|
|
|
|
|
|
|
|
|
|
|
|
|
|
|
|
|
|
Intact forests
|
Savannas
|
Other non-forest ecosystems
|
Human-altered systems
|
Total
|
Intact forests
|
Savannas
|
Other non-forest ecosystems
|
Human-altered systems
|
Total
|
Contribution
of each
gas
(%)
|
|
|
Gas
|
GWP
|
|
|
|
|
|
|
|
|
|
|
|
|
(1)
|
|
|
|
|
|
|
|
|
|
|
|
|
|
|
|
In 106
t of gas emitted
|
In 106 t
of CO2 gas equivalent
|
|
|
|
|
|
|
|
|
|
|
|
|
|
|
|
|
|
CO2
|
1
|
41.12
|
7.46
|
0.83
|
11.34
|
60.76
|
41.12
|
7.46
|
0.83
|
11.34
|
60.76
|
93.53
|
|
|
CH4
|
21
|
0.13
|
0.01
|
0.00
|
0.04
|
0.18
|
2.79
|
0.18
|
0.02
|
0.77
|
3.76
|
5.79
|
|
|
CO
|
0
|
3.18
|
0.32
|
0.04
|
0.88
|
4.42
|
0.00
|
0.00
|
0.00
|
0.00
|
0.00
|
0.00
|
|
|
N2O
|
310
|
0.00
|
0.00
|
0.00
|
0.00
|
0.001
|
0.31
|
0.04
|
0.00
|
0.09
|
0.44
|
0.68
|
|
|
NOx
|
0
|
0.04
|
0.01
|
0.00
|
0.01
|
0.06
|
0.00
|
0.00
|
0.00
|
0.00
|
0.00
|
0.00
|
|
|
NMHC
|
0
|
0.61
|
0.02
|
0.00
|
0.05
|
0.68
|
0.00
|
0.00
|
0.00
|
0.00
|
0.00
|
0.00
|
|
|
|
|
|
|
|
|
|
|
|
|
|
|
|
|
|
Total of CO2
gas equivalent
|
|
|
|
44.2
|
7.7
|
0.9
|
12.2
|
65.0
|
|
|
|
|
|
|
|
|
|
|
|
|
|
|
|
|
|
|
CO2-C
equivalent
|
|
|
|
|
12.1
|
2.1
|
0.2
|
3.3
|
17.7
|
|
|
|
|
|
|
|
|
|
|
|
|
|
|
|
|
|
|
|
|
|
|
|
|
|
|
|
|
|
|
|
|
|
|
|
|
|
|
|
|
|
|
|
|
|
|
|
|
|
|
|
|
|
|
|
|
|
|
|
|
|
|
|
|
|
|
High Scenario
|
|
|
|
|
|
|
|
|
|
|
|
|
|
|
|
|
|
|
|
|
|
|
|
|
|
|
|
|
|
|
|
|
Intact forests
|
Savannas
|
Other non-forest ecosystems
|
Human-altered systems
|
Total
|
Intact forests
|
Savannas
|
Other non-forest ecosystems
|
Human-altered systems
|
Total
|
Contribution
of each
gas
(%)
|
|
|
|
Gas
|
GWP
|
|
|
|
|
|
|
|
|
|
|
|
|
|
|
|
(1)
|
|
|
|
|
|
|
|
|
|
|
|
|
|
|
|
|
In 106
t of gas emitted
|
|
In 106 t
of CO2 gas equivalent
|
|
|
|
|
|
|
|
|
|
|
|
|
|
|
|
|
|
|
CO2
|
1
|
41.12
|
7.46
|
0.83
|
11.34
|
60.76
|
41.12
|
7.46
|
0.83
|
11.34
|
60.76
|
91.88
|
|
|
|
CH4
|
21
|
0.16
|
0.01
|
0.00
|
0.04
|
0.22
|
3.33
|
0.31
|
0.03
|
0.92
|
4.59
|
6.94
|
|
|
|
CO
|
0
|
3.98
|
0.43
|
0.05
|
1.10
|
5.56
|
0.00
|
0.00
|
0.00
|
0.00
|
0.00
|
0.00
|
|
|
|
N2O
|
310
|
0.00
|
0.00
|
0.00
|
0.00
|
0.003
|
0.56
|
0.06
|
0.01
|
0.15
|
0.78
|
1.18
|
|
|
|
NOx
|
0
|
0.06
|
0.01
|
0.00
|
0.02
|
0.09
|
0.00
|
0.00
|
0.00
|
0.00
|
0.00
|
0.00
|
|
|
|
NMHC
|
0
|
0.61
|
0.02
|
0.00
|
0.05
|
0.68
|
0.00
|
0.00
|
0.00
|
0.00
|
0.00
|
0.00
|
|
|
|
|
|
|
|
|
|
|
|
|
|
|
|
|
|
|
|
Total of CO2
gas equivalent
|
|
|
|
45.0
|
7.8
|
0.9
|
12.4
|
66.1
|
|
|
|
|
|
|
|
|
|
|
|
|
|
|
|
|
|
|
|
|
CO2-C
equivalent
|
|
|
|
|
12.3
|
2.1
|
0.2
|
3.4
|
18.0
|
|
|
|
|
|
|
|
|
|
|
|
|
|
|
|
|
|
|
|
|
(1) GWP= Global
warming potential (value adopted by the IPCC to weight to trace gases over a
100-year time horizon).
|
|
|
|
|
|
|
|
|
|
|
|
|
|
|
|
|
|
|
(2) The low and
high scenarios refer to the emission factors for non-CO2 trace
gases.
|
|
|
|
|
|
|
|
|
|
|
|
|
|
|
|
|
|
|
|
|
|
|
(3) The emission factors
that determine the amount of gas emitted per unit weight of carbon combusted
for forests and deforestation were taken from Fearnside (1997a) and IPCC/OECD
(1997), and for savannas and other non-forest
systems from Hurst et al. (1996) and IPCC/OECD (1994).
|
|
|
|
|
|
|
|
|
|
|
|
|
|
|
|
|
|
|
|
|
|
|
|
|
|
|
Conclusions
Forest fires initiated by anthropogenic burning in Amazonia in years of severe
drought, such as the one during the El Niño event in Roraima in 1997-98, can provoke
emission of large amounts of greenhouse gases to the atmosphere. Our results indicate that the primary forests
affected by the fire in 1997-98 in Roraima emitted 12.1-12.3 million tons of CO2-equivalent
carbon. Considering that every year many
burns penetrate forests all over Amazonia, it is possible that the estimates of
carbon released annually through forest disturbances in the Brazilian Amazon
are now larger than the 0.3 × 10⁹ t/yr that have been calculated for
deforestation (Fearnside, 1997a,b; Nepstad et al., 1999b). Human pressure, the expansion of disturbed
areas for clearings, pasture, agricultural fields and selective logging over
the last 20 years in Roraima, the ignition source that provoked the fires were
lead to burning 38,144-40,678 km2 of different habitats, including
11,394-13,928 km2 of primary forests. The El Niño event merely maximized the
effects of the increase in human activity in the forest systems of Roraima over
the few last years, indicating that the risk of fires of this magnitude
occurring throughout Amazonia is greater than was thought in the past.
ACKNOWLEDGMENTS
Ademir J. dos Santos, Antônio C.
Catâneo and Jaime França, of IBAMA, Carlo Zacquini of the Pro-Yanomami
Commission (CCPY/RR) and the Indigenous Council of Roraima (CIR) contributed
flight time from their projects to facilitate the measurements of area
burned. Rogério Gribel (INPA), Jeanine
Felfili (University of Brasília), Ary T. O. Filho (Federal University of
Lavras), Marco Aurélio Fontes (Federal University of Lavras) and Marcelo T.
Nascimento (Universidade do Norte Fluminense-UNEF) kindly made available their
original field data for comparisons with our base of calculations of the
mortality of individuals in the forest systems.
Viriato de Souza Cruz (ZEE/Roraima), made possible the measurements of
burned area by permitting us to use equipment and software at the Executive
Secretariat of ZEE/Roraima. Thelma Krug
and João Roberto dos Santos, both of INPE, provided information that
facilitated the final adjustment of the areas affected by the fires. Sebastião Pereira do
Nascimento and Herundino Ribeiro do Nascimento (Convention between INPA and the
Government of the State of Roraima)
assisted in the fieldwork. This is an
updated and corrected translation of Barbosa and Fearnside (1999).
LITERATURE CITED
Barbosa, R.I. 1993. Ocupação humana em Roraima. II . Uma revisão do equívoco da recente
política de desenvolvimento e o crescimento desordenado. Bol. Mus. Par. Emílio Goeldi (S.
Antrop.) 9(2): 177-197.
Barbosa,
R.I. 1997. Distribuição das chuvas em Roraima. In: Barbosa, R.I.; Ferreira, E.; Castellón, E. (eds.), Homem, Ambiente e Ecologia no Estado de
Roraima. INPA, Manaus. pp. 325-335.
Barbosa,
R.I. 1998a. Avaliação preliminar da área
dos sistemas naturais e agroecossistemas atingida por incêndios no Estado de
Roraima (01.12.1997 a 31.03.1998). Instituto Nacional de Pesquisas da
Amazônia / Núcleo de Pesquisas de Roraima (INPA/NPRR), 02.04.1998. Boa Vista, Roraima, Brazil. 18 pp. (manuscript).
Barbosa, R.I.
1998b. Avaliação da área dos sistemas
naturais e agroecossistemas atingida pelo fogo no Estado de Roraima (01.12.97 a
30.04.98). Instituto Nacional de Pesquisas da Amazônia / Núcleo de
Pesquisas de Roraima (INPA/NPRR), 16.05.98. Boa Vista, Roraima, Brazil. 21 pp+attachments. (manuscript).
Barbosa,
R.I. 1998c. Incêndios de Roraima
(1997/98): Área queimada, biomassa, mortalidade e formação de carvão nas
principais fitofisionomias. Instituto Nacional de Pesquisas da Amazônia /
Núcleo de Pesquisas de Roraima (INPA/NPRR), 04.12.98. Boa
Vista,
Roraima, Brazil. 20 pp. (manuscript).
Barbosa, R.I.; Fearnside, P.M. 1996. Pasture burning in
Amazonia: Dynamics of residual biomass and storage and release of abouveground
carbon. Journal of Geophysical Research
(Atmospheres) 101(D20):
25,847-25,857.
Barbosa, R.I.; Fearnside, P.M. 1999. Incêndios na Amazônia brasileira: Estimativa da
emissão de gases do efeito estufa pela queima de diferentes ecossistemas de
Roraima na passagem do evento "El Niño" (1997/98). Acta Amazonica 29(4): 513-534.
Bongers, F.; Engelen, D.; Klinge, H. 1985.
Phytomass structure of natural plant communities on spodosols in southern
Venezuela: the Bana woodland. Vegetatio 63: 13-34.
Braga, I.
1998. “FHC assume incêndio de Roraima.” Amazonas
em Tempo, Manaus, 9 July 1998. p. B4.
Brazil,
DEFARA/INMET. 1999. Mapa das
precipitações ocorridas em Boa Vista/RR no período de 01.01.97 a 25.03.99. Delegacia
Federal de Agricultura em Roraima / Instituto Nacional de Meteorologia (1o
Distrito de Meteorologia). 3 pp.
Brazil,
IBAMA. 1998. Avaliação rápida dos
impactos ambientais dos incêndios sobre as florestas no estado de Roraima;
versão revisada de setembro de 1998. Instituto Brasileiro do Meio Ambiente e
dos Recursos Naturais Renováveis (IBAMA), Brasília, Brazil. 91 pp. (manuscript).
Brazil,
IBGE. 1985. Censo Agropecuário 1985 -
Roraima. Instituto Brasileiro de Geografia e Estatística
(IBGE), Rio de Janeiro, Brazil. 238 pp.
Brazil, IBGE.
1992. Manual Técnico da Vegetação
Brasileira - Manuais Técnicos em Geociências no 1. Instituto Brasileiro de Geografia e Estatística (IBGE), Rio de
Janeiro, Brazil. 92 pp.
Brazil,
IBGE. 1996. Censo Agropecuário 1995-96
(Acre, Roraima e Amapá). Instituto Brasileiro de
Geografia e Estatística (IBGE), Rio de Janeiro, Brazil. 452 pp.
Brazil,
IBGE. 1999. Estimativa da população de
Roraima em 1997 e 1998. Instituto Brasileiro de Geografia
e Estatística / Superintendência Regional de Roraima, Boa Vista,
Roraima, Brazil. 1 p. (manuscript).
Brazil,
INPE. 1998. Estimativa da área de
cobertura florestal afetada pelo incêndio em Roraima, utilizando dados de
multi-sensores. (outubro de 1998). Instituto Nacional de Pesquisas
Espaciais (INPE) / Divisão de Sensoriamento Remoto, São José dos Campos, São
Paulo, Brazil. 71 pp. (manuscript).
Brazil,
INPE. 1999a. Estimativa da área de
cobertura florestal afetada pelo incêndio em Roraima a partir de dados de
satélite; janeiro de 1999. Instituto
Nacional de Pesquisas Espaciais (INPE), São José dos Campos, São Paulo, Brazil.
8 pp. (manuscript).
Brazil,
INPE. 1999b. Monitoramento da Floresta
Amazônica Brasileira por Satélite 1997-1998. Instituto Nacional de
Pesquisas Espaciais (INPE). São José dos Campos, São Paulo, Brazil. 22 pp.
Brazil,
MAA/INMET 1998. Observações meteorológicas do ano de 1998. Estação de Boa
Vista/RR. Ministério da Agricultura e do Abastecimento / Instituto Nacional de
Meteorologia / 1o Distrito de Meteorologia (Manaus). Manaus,
Amazonas, Brazil.
Brazil,
Projeto RADAMBRASIL. 1975-1978. Projeto
RADAMBRASIL - Levantamento dos Recursos Naturais; Volumes 8, 9, 10, 11, 14
e 18., Ministério das Minas e Energia, Rio de Janeiro, Brazil.
Brazil,
SUDAM and IBGE. 1989. Mapa de Vegetação
da Amazônia (1:2.500.000). Superintendência de Desenvolvimento da Amazônia
(SUDAM) and Instituto Brasileiro de Geografia e Estatística
(IBGE). Belém, Pará, Brazil.
Brown, S.; Lugo, A. 1992.
Aboveground biomass estimates for tropical moist forests of the Brazilian
Amazon. Interciencia 17(1): 8-18.
Carvalho,
J.A.; Santos, J.M.; Santos, J.C.; Leitão, M.M.; Higuchi, N. 1995. A tropical rainforest clearing experiment by biomass burning in the
Manaus region. Atmospheric
Environment 29(17): 2301-2309.
Castro, E.A. ; Kauffman, J.B. 1998.
Ecosystem structure in the Brazilian Cerrado: a vegetation gradient of aboveground
biomass, root mass and comsuption by fire. Journal
of Tropical Ecology 14: 263-283.
Cochrane, M.A.; Alencar, A.; Schulze, M.D.; Souza, C.M.;
Nepstad, D.C.; Lefebvre, P.; Davidson, E.A. 1999. Positive
feedbacks in the fire dynamic of closed canopy tropical forests. Science 284: 1832-1835.
Cochrane, M.A.; Schulze, M.D. 1999.
Fire as a recurrent event in tropical forests of the Eastern Amazon: effects on
forest structure, biomass, and species composition. Biotropica 31(1): 2-16.
Eastman, J.R. 1995. Idrisi for Windows (v 1.0). Clark University, Worcester, Massachusetts, U.S.A.
Fearnside, P.M. 1992. Forest biomass in Brazilian Amazônia:
Comments on the estimate by Brown and Lugo. Interciencia
17(1): 19-27.
Fearnside, P.M. 1996. Amazonia and the global warming:
Annual balance of greenhouse gas emissions from land-use change in Brazil's
Amazon region. In: J.S. Levine (ed.),
Biomass Burning and Global Change,
vol. 2. Massachusetts Institute of Technology, Boston, Massachusetts, U.S.A.
pp. 606-617.
Fearnside, P.M. 1997a. Greenhouse gases from deforestation
in Brazilian Amazonia: Net commited emissions. Climatic Change 35(3): 321-360.
Fearnside,
P.M. 1997b. Roraima e o aquecimento global: Balanço anual das emissões de gases
do efeito estufa provenientes da mudança de uso da terra. In: Barbosa, R.I.; Ferreira, E.; Castellón, E. (eds.), Homem, Ambiente e Ecologia no Estado de
Roraima. Instituto Nacional de Pesquisas da Amazônia (INPA), Manaus,
Amaznas, Brazil. pp. 337-359.
Fearnside,
P.M.; Graça, P.M.L.A.; Leal Filho, N.; Rodrigues, F.J.A.; Robinson, J.M. 1999. Tropical
forest burning in Brazilian Amazonia: Measurement of biomass loading, burning
efficiency and charcoal formation at Altamira, Pará. Forest Ecology and Management 123: 65-79.
Fearnside, P.M.; Barbosa, R.I.; Graça,
P.M.L.A. (nd). Burning of
secondary forest in Amazonia: Biomass, burning efficiency and charcoal
formation during land preparation for agriculture in Roraima, Brazil. (manuscript).
Higuchi,
N.; Santos, J.; Ribeiro, R.J.; Minette, L.; Biot, Y. 1997. Biomassa da parte
aérea da vegetação da floresta tropical úmida de terra-firme da Amazônia
Brasileira. In: Biomassa e Nutrientes
Florestais - Projeto BIONTE/Relatório Final. MCT-INPA/DFID. Manaus,
Amazonas, Brazil. pp. 49-64.
Higuchi,
N.; Santos, J.; Ribeiro, R.J.; Minette, L.; Biot, Y. 1998. Biomassa da parte
aérea da vegetação da floresta tropical úmida de terra-firme da Amazônia
Brasileira. Acta Amazonica
28(2): 153-166.
Holdsworth, A.R.; Uhl, C. 1997. Fire in eastern Amazonian logged rain forest and the potential for
fire reduction. Ecological Applications 7(2): 713-725.
Hurst, D.F.; Griffith, D.W.T.; Cook, G.D.
1996. Trace-gas emissions from biomass burning in Australia. In: J.S. Levine (ed), Biomass
burning and global change, Volume 2. Massachusetts Institute
of Technology, Boston, Massachusetts, U.S.A. pp. 787-792.
IPCC/OECD. 1994. Greenhouse gas inventory reporting
instructions (final draft). IPCC Draft Guidlines for
National Greenhouse Gas Inventories (Vol. 1). IPCC/OECD
Joint Programme. pp. 4.69-4.72 (Total Carbon Released from Savanna
Burning). IPCC, World Meteorologial Organization, Geneva, Switzerland.
IPCC/OECD. 1997. Greenhouse gas inventory : reference manual. In: Houghton, J.T.; Meira Filho, L.G.; Lim, B.; Tréanton, K.; Mamaty,
I.; Bonduki, Y.; Griggs, D.J. and Callander, B.A. (eds.) Revised 1996 IPCC Guidelines for National Greenhouse Gas Inventories
(Vol. 3). IPCC, World Meteorologial Organization, Geneva, Switzerland. pp. 5.30-5.34.
Kauffman, J.B. 1991. Survival by sprouting
following fire in tropical forests of the Eastern Amazon. Biotropica 23(3): 219-224.
Kauffman, J.B.; Uhl, C.; Cummings, D.L.
1988. Fire in Venezuelan Amazon 1: Fuel biomass and fire chemistry in
the evergreen rainforest of Venezuela. Oikos
53: 167-175.
Klinge, H. ; Herrera, R. 1983.
Phytomass structure of natural plant communities on spodosols in southern Venezuela: the Tall Amazon Caatinga
forest. Vegetatio 53: 65-84.
Luz, F.J.F.
1999. Resumo dos diagnósticos dos
Assentamentos do INCRA em Roraima (1998/99). (manuscript).
Nascimento, M.T. 1994. A
monodominant rain forest on Maracá Island, Roraima, Brazil: Forest structure
and dynamics. Ph.D Thesis. University of Stirling, Stirling, U.K.
146 pp.
Negreiros,
G.H.; Sandberg, D.; Alvarado, E.; Hinckley, T.;
Nepstad, D.C.; Pereira, M. 1996. Fire along the
transition between the Amazon forest and Cerrado ecosystems. In: 13th Conference on Fire and
Forest Meteorology (27-31 October), Lorne, Australia.
Nelson,
B.W.; Irmão, M.N. 1998. Fire penetration in standing
Amazon forests. In: IX Simpósio Brasileiro de Sensoriamento
Remoto, Santos (11
a 18 de setembro de 1998)______.
Nepstad,
D.C.; Moreira, A.G.; Alencar, A.A. 1999a. Flames in the rain forest:
origins, impacts and alternatives to Amazonian fire. Pilot
Program to Conserve the Brazilian Rain Forest and World Bank. Brasília, Brazil. 161 pp.
Nepstad,
D.C.; Veríssimo, A.; Alencar, A.; Nobre, C.; Lima, E.; Lefebvre, P.;
Schlesinger, P.; Potter, C.; Moutinho, P.; Mendoza, E.; Cochrane, M.; Brooks,
V. 1999b. Large-scale impoverishment of Amazonian
forests by logging and fire. Nature 398: 505-508.
Roraima,
SENAGRO and ITERAIMA. 1996. Mosaico de
Imagens LANDSAT TM (1:1.000.000) do Estado de Roraima. SENAGRO,
______??_Curitiba., Paraná, Brazil.
Santos,
J.R.; Pardi Lacruz, M.S.; Araújo, L.S.; Xaud, H.A.M. 1998. El proceso de queima
de biomassa de bosque tropical y de sabanas en la Amazonia Brasilera:
Experiencias de monitoreo com dados ópticos y de microondas. Revista Série Geográfica, 7: 97-108.
Schimel, D. and 75 others. 1996.
Radiative forcing of climate change. In: Houghton, J.T.; Meira Filho, L.G.;
Callander, B.A.; Harris, N.; Kattenberg, A.; Maskell, K. (eds), Climate Change 1995: The Science of Climate
Change, Cambridge University Press, Cambridge, U.K., pp. 65-131.
Scott, D.A.; Proctor, J.; Thompson, J.
1992. Ecological studies on lowland evergreen rain forest on Maracá
Island, Roraima, Brazil. II . Litter
and nutrient cycling. Journal of
Ecology 80: 705-717.
Shulze, M.D. 1998. Forest fires in
the Brazilian Amazon. Conservation
Biology 12(5): 948-950.
Silva, E.L.S. 1997. A vegetação de Roraima. In: Barbosa, R.I.; Ferreira, E.;
Castellón, E. (eds.), Homem, Ambiente e
Ecologia no Estado de Roraima. Instituto Nacional de Pesquisas da Amazônia
(INPA), Manaus, Amazonas, Brazil. pp. 401-415
Thompson, J.; Proctor, J.; Viana, V.;
Milliken, W.; Ratter, J.A.; Scott, D.A. 1992. Ecological studies on a
lowland evergreen rain forest on Maracá Island, Roraima, Brazil. I. Physical
environmental, forest structure and leaf chemistry. Journal of Ecology 80: 689-703.
Uhl, C.; Kauffman, J.B.; Cummings, D.L.
1988. Fire in the Venezuelan Amazon 2: Environmental conditions
necessary for forest fires in the evergreen rainforest of Venezuela. Oikos 53: 176-184.
Villela, D.M. 1995. Nutrient cycling in a monodominant and other rain forest types on Maracá Island, Brazil. Ph.D Thesis. University of Stirling, Stirling, U.K. 138 pp.